Genetics at University of New Hampshire-Main Campus
If you are interested in studying Genetics, take a look at what University of New Hampshire-Main Campus. We’ve gathered the following information to help you decide.
University of New Hampshire-Main Campus sits in Durham, NH.
For the most recent IPEDS reporting year, 28 genetics graduations were recorded at University of New Hampshire-Main Campus.
Featured schools near , edit
Online & Distance Learning at University of New Hampshire-Main Campus
Online coursework is an option at University of New Hampshire-Main Campus. Among 13,554 students, 663 (5%) were enrolled entirely in distance education and 2,418 (18%) took at least some classes online.
Earnings for Genetics Graduates from University of New Hampshire-Main Campus
Those who finish University of New Hampshire-Main Campus’s Genetics program earn at the following median levels (per the U.S. Department of Education’s College Scorecard):

| Years After Graduation | Median Earnings |
|---|---|
| 1 year | $37,487 |
| 2 years | $44,356 |
| 3 years | $46,337 |
| 4 years | $63,166 |
| 5 years | $80,032 |
How does this compare to the school overall? Four years after graduating, Genetics graduates from University of New Hampshire-Main Campus earn a median of $63,166, compared with $61,771 for all University of New Hampshire-Main Campus graduates — about 2% higher than the school-wide median.

Median Debt at Graduation
The median debt for Genetics graduates from University of New Hampshire-Main Campus stands at $26,994.
Student Demographics & Diversity
The following sections describe the diversity of Genetics graduates at University of New Hampshire-Main Campus, by degree type.
Looking at the program as a whole, Genetics graduates at University of New Hampshire-Main Campus are 64% women (18) and 36% men (10).
Genetics Bachelor’s Program at University of New Hampshire-Main Campus
Among the 20 bachelor’s genetics graduates at University of New Hampshire-Main Campus, 75% were women (15) and 25% were men (5).

The following table and chart show the race/ethnicity of Genetics bachelor’s degree recipients at University of New Hampshire-Main Campus.
| Race / Ethnicity | Number of Graduates |
|---|---|
| White | 14 |
| Hispanic / Latino | 1 |
| Two or More Races | 1 |
| Unknown | 4 |

Minority students account for 10% of Genetics bachelor’s degree recipients at University of New Hampshire-Main Campus, lower than the national average of 28%.*
Genetics Master’s Program at University of New Hampshire-Main Campus
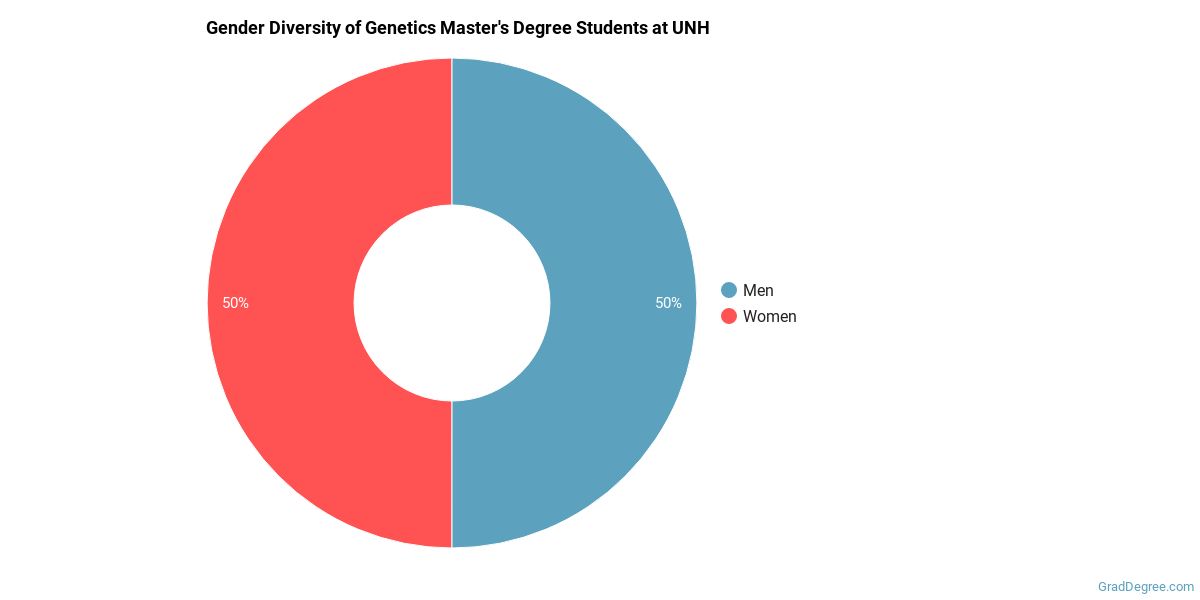
Among the 4 master’s genetics degrees awarded at University of New Hampshire-Main Campus, 50% were women (2) and 50% were men (2).
The following table and chart show the race/ethnicity of Genetics master’s degree recipients at University of New Hampshire-Main Campus.
| Race / Ethnicity | Number of Graduates |
|---|---|
| White | 2 |
| Black / African American | 1 |
| International (Nonresident) | 1 |
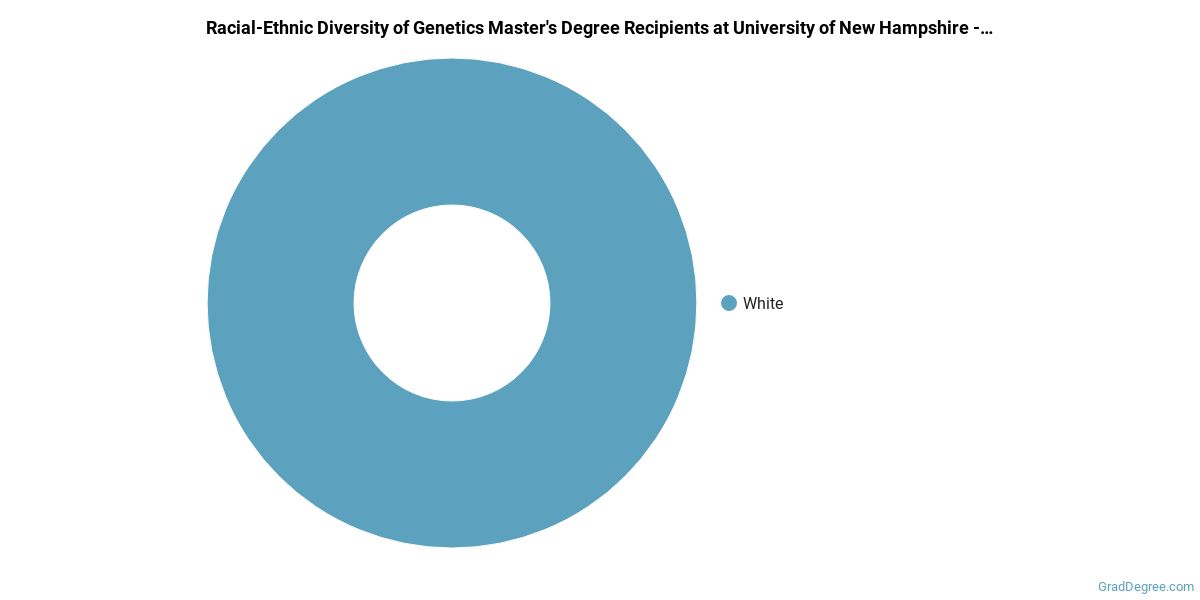
Racial-ethnic minorities make up 25% of Genetics master’s degree recipients at University of New Hampshire-Main Campus, below the national average of 30%.*
Genetics Doctoral Program at University of New Hampshire-Main Campus
Of the 4 doctoral genetics degrees awarded at University of New Hampshire-Main Campus, 25% were women (1) and 75% were men (3).

The following table and chart show the race/ethnicity of Genetics doctoral degree recipients at University of New Hampshire-Main Campus.
| Race / Ethnicity | Number of Graduates |
|---|---|
| White | 3 |
| International (Nonresident) | 1 |

*The racial-ethnic minorities figure is the total number of graduates minus White, international (nonresident), and unknown-race graduates.
More Specific Genetics Concentrations at University of New Hampshire-Main Campus
This Genetics program at University of New Hampshire-Main Campus includes the following sub-specializations:
| Concentration | Graduates |
|---|---|
| General Genetics | 28 |
Top-Paying Careers for Genetics Graduates
Graduates of the Genetics program at University of New Hampshire-Main Campus pursue many career paths. Below are the top-paying careers for Genetics majors, ordered by median annual salary:
| Occupation | Nationwide Median Wage |
|---|---|
| Water Resource Specialists | $179,716 |
| Natural Sciences Managers | $132,227 |
| Medical Scientists, Except Epidemiologists | $111,314 |
| Clinical Research Coordinators | $110,931 |
| Biological Technicians | $100,160 |
| Molecular and Cellular Biologists | $100,077 |
| Bioinformatics Scientists | $92,484 |
| Biological Scientists, All Other | $79,550 |
| Genetic Counselors | $58,726 |
| Biologists | $54,070 |
References
- IPEDS — Integrated Postsecondary Education Data System
- U.S. Department of Education — College Scorecard
- O*NET Online (Bureau of Labor Statistics)
- National Center for Education Statistics
More about our data sources and methodologies.
GradDegree.com provides higher-education, college and university, degree, program, career, salary, and other helpful information to students, faculty, institutions, and other internet audiences. Presented information and data are subject to change. Inclusion on this website does not imply or represent a direct relationship with the company, school, or brand. Information, though believed correct at time of publication, may not be correct, and no warranty is provided. Contact the schools to verify any information before relying on it. Financial aid may be available for those who qualify. The displayed options may include sponsored or recommended results, not necessarily based on your preferences.
© GradDegree.com – All Rights Reserved.