Neurobiology & Neurosciences at University of California-Davis
If you are interested in studying Neurobiology & Neurosciences, consider the program at University of California-Davis. Get started with the following essential facts.
University of California-Davis is in Davis, CA.
During the most recent reporting year, 401 neurobiology & neurosciences degrees were granted at University of California-Davis.
Featured schools near , edit
Studying Online at University of California-Davis
Many students take online classes at University of California-Davis. Of 40,065 students, 336 (1%) studied exclusively online and 4,339 (11%) took at least some classes online.
Neurobiology & Neurosciences Rankings at University of California-Davis
Use these rankings to compare University of California-Davis’s Neurobiology & Neurosciences program to other colleges that offer this major.
Doctoral-Level Rankings
| Ranking | Scope | Rank |
|---|---|---|
| Best Schools (Quality) | California | #7 of 14 |
| Best Value | California | #7 of 14 |
| Best Schools (Quality) | Far Western (Region) | #8 of 21 |
| Best Value | Far Western (Region) | #9 of 20 |
| Best Value | Nationwide | #21 of 187 |
| Best Schools (Quality) | Nationwide | #43 of 191 |
Earnings for Neurobiology & Neurosciences Graduates from University of California-Davis
Those who finish University of California-Davis’s Neurobiology & Neurosciences program earn at the following median levels (per the U.S. Department of Education’s College Scorecard):

| Years After Graduation | Median Earnings |
|---|---|
| 1 year | $28,232 |
| 2 years | $30,047 |
| 3 years | $30,474 |
| 4 years | $51,750 |
| 5 years | $67,848 |
How does this compare to the school overall? At the four-year mark, Neurobiology & Neurosciences graduates from University of California-Davis report median earnings of $51,750, compared with $64,648 for all University of California-Davis graduates — about 20% lower than the school-wide median.

Median Debt at Graduation
The median debt for Neurobiology & Neurosciences graduates from University of California-Davis stands at $13,000.
Student Demographics & Diversity
Below you’ll find the student demographics for Neurobiology & Neurosciences graduates at University of California-Davis, by degree type.
Across all degree levels, Neurobiology & Neurosciences graduates at University of California-Davis are 69% women (278) and 31% men (123).
Neurobiology & Neurosciences Bachelor’s Program at University of California-Davis
Of the 387 bachelor’s neurobiology & neurosciences degrees awarded at University of California-Davis, 69% were women (267) and 31% were men (120).

The following table and chart show the race/ethnicity of Neurobiology & Neurosciences bachelor’s degree recipients at University of California-Davis.
| Race / Ethnicity | Number of Graduates |
|---|---|
| White | 82 |
| Hispanic / Latino | 58 |
| Black / African American | 6 |
| Asian | 186 |
| Native Hawaiian / Pacific Islander | 1 |
| Two or More Races | 29 |
| International (Nonresident) | 16 |
| Unknown | 9 |

Racial-ethnic minorities make up 72% of Neurobiology & Neurosciences bachelor’s degree recipients at University of California-Davis, above the national average of 47%.*
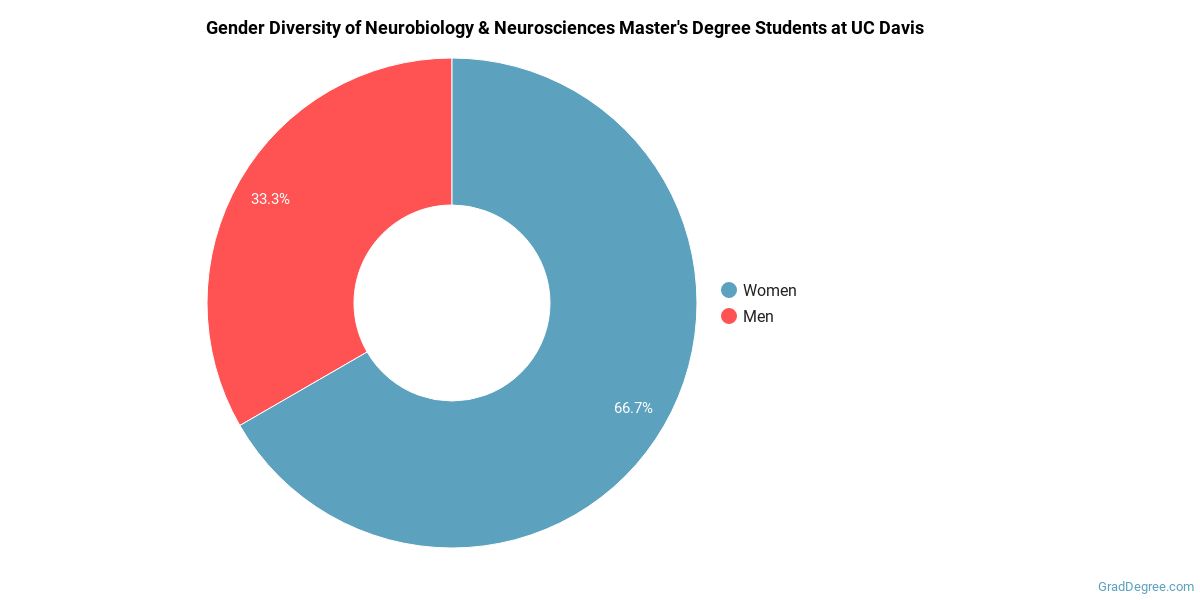
Neurobiology & Neurosciences Master’s Program at University of California-Davis
Among the 2 master’s neurobiology & neurosciences graduates at University of California-Davis, 100% were women (2) and 0% were men (0).
The following table and chart show the race/ethnicity of Neurobiology & Neurosciences master’s degree recipients at University of California-Davis.
| Race / Ethnicity | Number of Graduates |
|---|---|
| White | 1 |
| Hispanic / Latino | 1 |
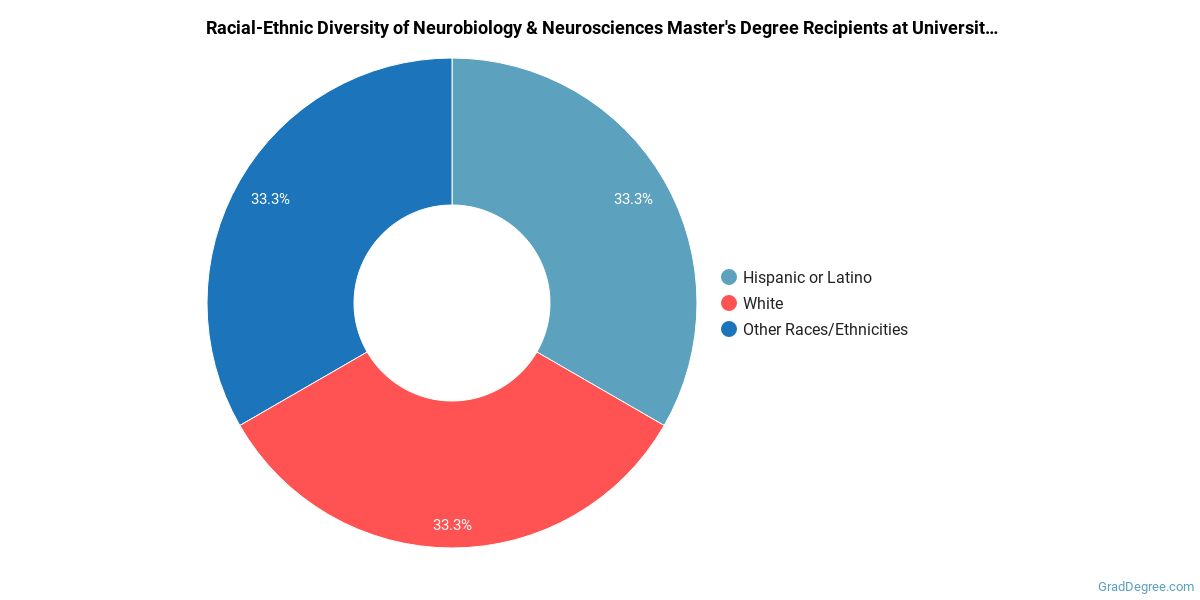
Minority students account for 50% of Neurobiology & Neurosciences master’s degree recipients at University of California-Davis, higher than the national average of 38%.*
Neurobiology & Neurosciences Doctoral Program at University of California-Davis
Of the 12 doctoral neurobiology & neurosciences graduates at University of California-Davis, 75% were women (9) and 25% were men (3).

The following table and chart show the race/ethnicity of Neurobiology & Neurosciences doctoral degree recipients at University of California-Davis.
| Race / Ethnicity | Number of Graduates |
|---|---|
| White | 5 |
| Hispanic / Latino | 3 |
| Black / African American | 2 |
| Asian | 1 |
| Two or More Races | 1 |

Racial-ethnic minorities make up 58% of Neurobiology & Neurosciences doctoral degree recipients at University of California-Davis, above the national average of 30%.*
*The racial-ethnic minorities figure is the total number of graduates minus White, international (nonresident), and unknown-race graduates.
More Specific Neurobiology & Neurosciences Concentrations at University of California-Davis
The Neurobiology & Neurosciences program at University of California-Davis offers more specialized concentrations:
| Concentration | Graduates |
|---|---|
| Neurosciences | 14 |
| Neurobiology & Anatomy | 387 |
Top-Paying Careers for Neurobiology & Neurosciences Graduates
Graduates of the Neurobiology & Neurosciences program at University of California-Davis go on to a range of careers. The table below ranks the best-paid careers for Neurobiology & Neurosciences majors, ordered by median annual salary:
| Occupation | Nationwide Median Wage |
|---|---|
| Water Resource Specialists | $179,716 |
| Natural Sciences Managers | $132,227 |
| Medical Scientists, Except Epidemiologists | $111,314 |
| Clinical Research Coordinators | $110,931 |
| Biological Technicians | $100,160 |
| Molecular and Cellular Biologists | $100,077 |
| Bioinformatics Scientists | $92,484 |
| Biological Scientists, All Other | $79,550 |
| Biologists | $54,070 |
| Geneticists | $48,526 |
References
- IPEDS — Integrated Postsecondary Education Data System
- U.S. Department of Education — College Scorecard
- O*NET Online (Bureau of Labor Statistics)
- National Center for Education Statistics
More about our data sources and methodologies.
GradDegree.com provides higher-education, college and university, degree, program, career, salary, and other helpful information to students, faculty, institutions, and other internet audiences. Presented information and data are subject to change. Inclusion on this website does not imply or represent a direct relationship with the company, school, or brand. Information, though believed correct at time of publication, may not be correct, and no warranty is provided. Contact the schools to verify any information before relying on it. Financial aid may be available for those who qualify. The displayed options may include sponsored or recommended results, not necessarily based on your preferences.
© GradDegree.com – All Rights Reserved.