Master’s Degrees in Political Science & Government
Featured schools near , edit
Education Levels of Political Science Majors
During the most recent year for which data is available, 1,889 people earned their master's degree in political science. This earns it the #71 spot on the list of the most popular master's degree programs in the nation.
The following table shows the number of diplomas awarded in political science at each degree level.
| Education Level | Number of Grads |
|---|---|
| Master’s Degree | 1,889 |
| Doctor’s Degree | 731 |
| Graduate Certificate | 73 |
Earnings of Political Science Majors With Master’s Degrees
The median salary for graduates holding a master's degree in political science is $47,403. This number may vary for a lot of reasons. For instance, you may decide to move to a location where people with your degree are rare and make more money. To get a better picture, earnings for this category of people can range from a low of $43,420 to a high of $50,644.

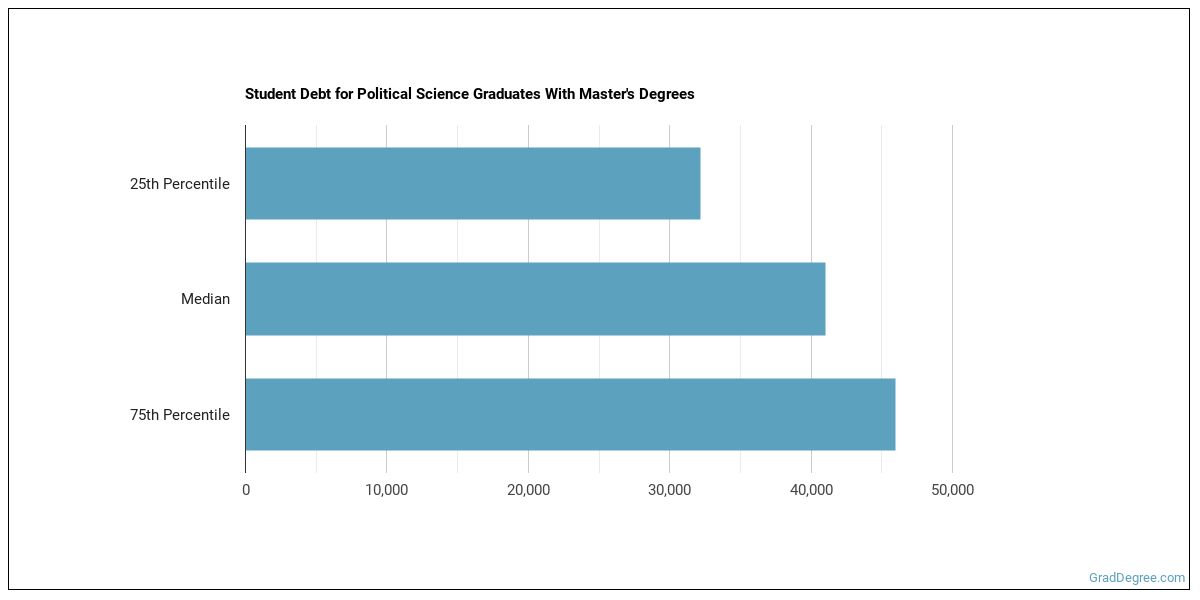
Student Debt
The median student debt for graduates holding a master's degree in political science is $39,051. The length of time it takes you to graduate and what college you attend can affect this number quite a bit. The chart below shows the range of accumulated debt loads. On the high side of the range, $50,619 is the debt load, and the debt load on the low side is $34,221.
Student Diversity
More men than women pursue master's degrees in political science. About 52.5% of graduates in this field are male.
| Gender | Number of Grads |
|---|---|
| Men | 991 |
| Women | 898 |

The racial-ethnic distribution of political science master’s degree students is as follows:
| Race/Ethnicity | Number of Grads |
|---|---|
| Asian | 84 |
| Black or African American | 142 |
| Hispanic or Latino | 197 |
| White | 1,011 |
| International Students | 299 |
| Other Races/Ethnicities | 156 |

Most Popular Political Science Programs for Master’s Degrees
There are 226 colleges that offer a master’s degree in political science. Learn more about the most popular 20 below:

The most popular school in the United States for political science students seekinga master's degree is George Washington University. Roughly 27,000 attend the school each year. The average in-state tuition for full-time undergraduates is $60,856 per year, while in-state graduate students, on average, pay $33,930 per year. During the most recent year for which we have data, 173 people received their master's degree in political science from GWU. Of these students, 41% were women and 29% were members of underrepresented racial-ethnic groups.

Johns Hopkins University is the 2nd most popular school in the nation for students seeking a master's degree in political science. Each year, around 28,800 students seeking various degrees attend the university. The average in-state tuition for full-time undergraduates is $60,480 per year, while in-state graduate students, on average, pay $60,480 per year. During the most recent year for which we have data, 108 people received their master's degree in political science from Johns Hopkins. Around 26% of these students were from an underrepresented racial-ethnic group, and 42% were women.

Harvard University is the 3rd most popular school in the nation for students seeking a master's degree in political science. Roughly 30,300 attend the school each year. The average in-state tuition for full-time undergraduates is $52,659 per year, while in-state graduate students, on average, pay $52,456 per year. During the most recent year for which we have data, 58 people received their master's degree in political science from Harvard. Of these students, 49% were women and 29% were members of underrepresented racial-ethnic groups.

The 4th most popular school in the country for political science majors who are seeking their master's degree is Georgetown University. Roughly 19,300 attend the school each year. The average in-state tuition for full-time undergraduates is $61,872 per year, while in-state graduate students, on average, pay $56,592 per year. During the most recent year for which we have data, 49 people received their master's degree in political science from Georgetown. Of these students, 55% were women and 16% were members of underrepresented racial-ethnic groups.

The 5th most popular school in the country for political science majors who are seeking their master's degree is New York University. Each year, around 52,700 students seeking various degrees attend the university. The average in-state tuition for full-time undergraduates is $55,384 per year, while in-state graduate students, on average, pay $37,332 per year. During the most recent year for which we have data, 46 people received their master's degree in political science from NYU. Around 14% of these students were from an underrepresented racial-ethnic group, and 48% were women.

The 6th most popular school in the country for political science majors who are seeking their master's degree is Southern New Hampshire University. Roughly 134,300 attend the school each year. The average in-state tuition for full-time undergraduates is $15,000 per year, while in-state graduate students, on average, pay $18,900 per year. During the most recent year for which we have data, 40 people received their master's degree in political science from SNHU. Around 25% of these students were from an underrepresented racial-ethnic group, and 75% were women.

Florida State University is the 7th most popular school in the nation for students seeking a master's degree in political science. Roughly 43,500 attend the school each year. The average in-state tuition for full-time undergraduates is $4,640 per year, while in-state graduate students, on average, pay $9,684 per year. During the most recent year for which we have data, 35 people received their master's degree in political science from Florida State. About 52% of this group were women, and 17% were students from an underrepresented racial-ethnic group.

American Public University System is the 8th most popular school in the nation for students seeking a master's degree in political science. Roughly 50,000 attend the school each year. The average in-state tuition for full-time undergraduates is $6,840 per year, while in-state graduate students, on average, pay $6,660 per year. During the most recent year for which we have data, 34 people received their master's degree in political science from American Military University. Of these students, 37% were women and 34% were members of underrepresented racial-ethnic groups.

Columbia University in the City of New York comes in at #9 on our list of the most popular colleges offering master's degrees in political science. Roughly 30,100 attend the school each year. The average in-state tuition for full-time undergraduates is $61,989 per year, while in-state graduate students, on average, pay $52,016 per year. During the most recent year for which we have data, 33 people received their master's degree in political science from Columbia. Of these students, 52% were women and 14% were members of underrepresented racial-ethnic groups.

Yale University comes in at #10 on our list of the most popular colleges offering master's degrees in political science. Each year, around 12,000 students seeking various degrees attend the university. The average in-state tuition for full-time undergraduates is $62,250 per year, while in-state graduate students, on average, pay $46,900 per year. During the most recent year for which we have data, 30 people received their master's degree in political science from Yale. Around 19% of these students were from an underrepresented racial-ethnic group, and 19% were women.

Regent University comes in at #10 on our list of the most popular colleges offering master's degrees in political science. Each year, around 10,400 students seeking various degrees attend the university. The average in-state tuition for full-time undergraduates is $18,080 per year, while in-state graduate students, on average, pay $16,028 per year. During the most recent year for which we have data, 30 people received their master's degree in political science from Regent. Of these students, 68% were women and 32% were members of underrepresented racial-ethnic groups.

The 12th most popular school in the country for political science majors who are seeking their master's degree is University of California - Berkeley. Roughly 42,300 attend the school each year. The average in-state tuition for full-time undergraduates is $11,564 per year, while in-state graduate students, on average, pay $11,700 per year. During the most recent year for which we have data, 29 people received their master's degree in political science from UC Berkeley. Of these students, 42% were women and 58% were members of underrepresented racial-ethnic groups.

The 12th most popular school in the country for political science majors who are seeking their master's degree is Liberty University. Each year, around 93,300 students seeking various degrees attend the university. The average in-state tuition for full-time undergraduates is $15,467 per year, while in-state graduate students, on average, pay $7,893 per year. During the most recent year for which we have data, 29 people received their master's degree in political science from Liberty University. Around 21% of these students were from an underrepresented racial-ethnic group, and 18% were women.

The 14th most popular school in the country for political science majors who are seeking their master's degree is University of Illinois at Springfield. Roughly 4,100 attend the school each year. The average in-state tuition for full-time undergraduates is $9,758 per year, while in-state graduate students, on average, pay $8,858 per year. During the most recent year for which we have data, 27 people received their master's degree in political science from UIS. Around 19% of these students were from an underrepresented racial-ethnic group, and 58% were women.

The 14th most popular school in the country for political science majors who are seeking their master's degree is The Graduate Center, CUNY. Roughly 9,300 attend the school each year. The average in-state tuition for full-time undergraduates is $6,930 per year, while in-state graduate students, on average, pay $9,930 per year. During the most recent year for which we have data, 27 people received their master's degree in political science from The Graduate Center. Around 25% of these students were from an underrepresented racial-ethnic group, and 41% were women.

Eastern Illinois University comes in at #16 on our list of the most popular colleges offering master's degrees in political science. Roughly 8,600 attend the school each year. The average in-state tuition for full-time undergraduates is $9,417 per year, while in-state graduate students, on average, pay $7,691 per year. During the most recent year for which we have data, 25 people received their master's degree in political science from EIU. Of these students, 57% were women and 19% were members of underrepresented racial-ethnic groups.

The 17th most popular school in the country for political science majors who are seeking their master's degree is St John's University - New York. Each year, around 20,100 students seeking various degrees attend the university. The average in-state tuition for full-time undergraduates is $45,760 per year, while in-state graduate students, on average, pay $31,233 per year. During the most recent year for which we have data, 23 people received their master's degree in political science from STJ. Around 70% of these students were from an underrepresented racial-ethnic group, and 50% were women.

University of North Carolina at Chapel Hill comes in at #18 on our list of the most popular colleges offering master's degrees in political science. Each year, around 30,000 students seeking various degrees attend the university. The average in-state tuition for full-time undergraduates is $7,019 per year, while in-state graduate students, on average, pay $10,552 per year. During the most recent year for which we have data, 20 people received their master's degree in political science from UNC Chapel Hill. Of these students, 64% were women and 11% were members of underrepresented racial-ethnic groups.

The 19th most popular school in the country for political science majors who are seeking their master's degree is University of Nebraska at Omaha. Each year, around 15,800 students seeking various degrees attend the university. The average in-state tuition for full-time undergraduates is $6,344 per year, while in-state graduate students, on average, pay $6,138 per year. During the most recent year for which we have data, 19 people received their master's degree in political science from UNOMAHA. Around 15% of these students were from an underrepresented racial-ethnic group, and 54% were women.

Princeton University is the 19th most popular school in the nation for students seeking a master's degree in political science. Roughly 7,800 attend the school each year. The average in-state tuition for full-time undergraduates is $57,410 per year, while in-state graduate students, on average, pay $57,410 per year. During the most recent year for which we have data, 19 people received their master's degree in political science from Princeton. Of these students, 42% were women and 12% were members of underrepresented racial-ethnic groups.
Political Science Concentrations
| Major | Annual Degrees Awarded |
|---|---|
| 1,652 | |
| 153 | |
| 75 | |
| 9 |
Explore Major by State
Alabama
Arkansas
Connecticut
Florida
Idaho
Iowa
Louisiana
Massachusetts
Mississippi
Nebraska
New Jersey
North Carolina
Oklahoma
Rhode Island
Tennessee
Vermont
West Virginia
Related Majors
Below are some popular majors that are similar to political science that offer master’s degrees.
| Major | Annual Degrees Awarded |
|---|---|
| 4,686 | |
| 4,650 | |
| 1,428 | |
| 1,248 | |
| 1,001 |
References
*The racial-ethnic minority student count is calculated by taking the total number of students and subtracting white students, international students, and students whose race/ethnicity was unknown. This number is then divided by the total number of students at the school to obtain the percentage of racial-ethnic minorities.
- College Factual
- National Center for Education Statistics
- O*NET Online
- Bureau of Labor Statistics
- Image Credit: By UKWiki at English Wikipedia under License
More about our data sources and methodologies.
Featured Schools
GradDegree.com provides higher-education, college and university, degree, program, career, salary, and other helpful information to students, faculty, institutions, and other internet audiences. Presented information and data are subject to change. Inclusion on this website does not imply or represent a direct relationship with the company, school, or brand. Information, though believed correct at time of publication, may not be correct, and no warranty is provided. Contact the schools to verify any information before relying on it. Financial aid may be available for those who qualify. The displayed options may include sponsored or recommended results, not necessarily based on your preferences.
© GradDegree.com – All Rights Reserved.