Health/Medical Admin Services Schools in Ohio
Featured schools near , edit

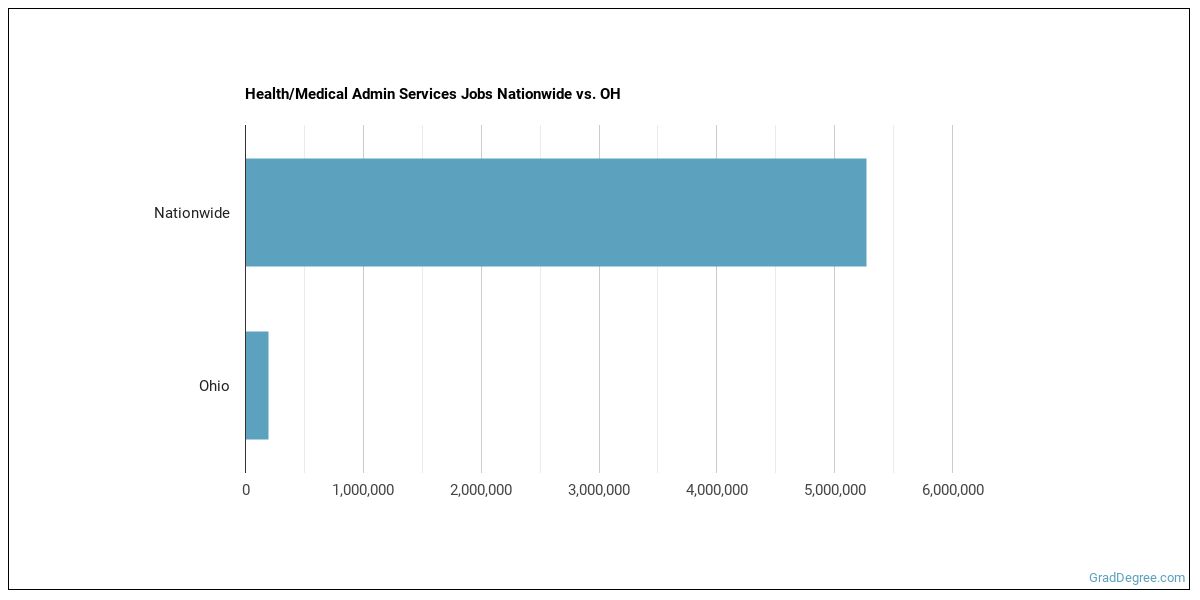
Jobs for Health/Medical Admin Services Grads in Ohio
In this state, there are 225,570 people employed in jobs related to a Health & Medical Administrative Services degree, compared to 7,068,570 nationwide.
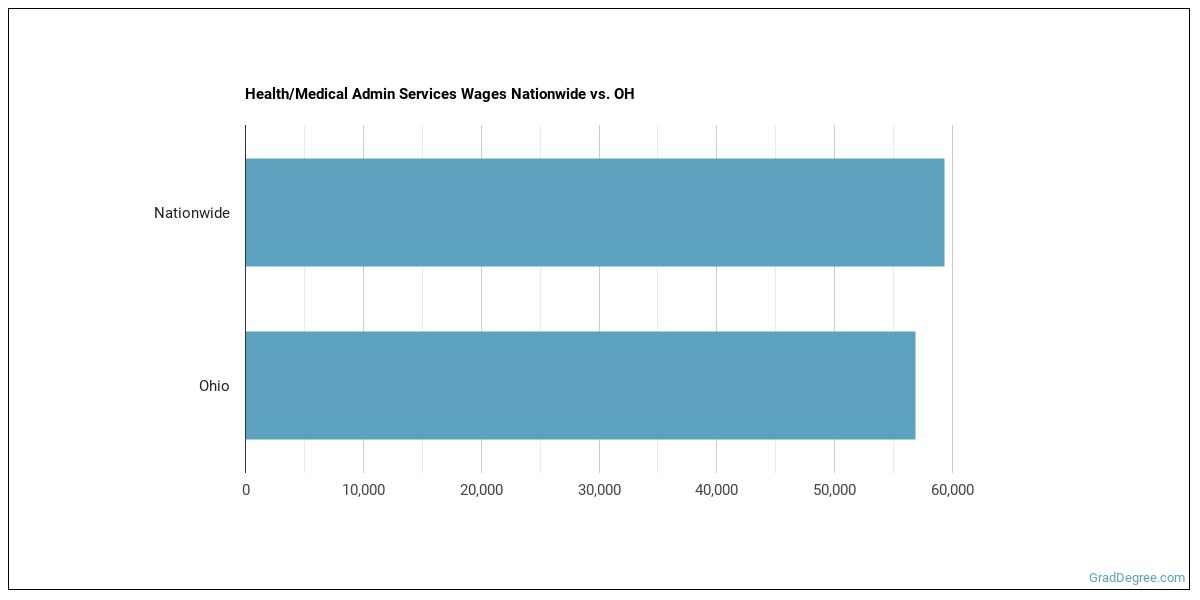
Wages for Health/Medical Admin Services Jobs in Ohio
Health & Medical Administrative Services grads earn an average of $73,867 in the state and $83,823 nationwide.
Most Popular Health/Medical Admin Services Programs in OH
There are 10 colleges in Ohio that offer Health & Medical Administrative Services degrees in our data. Learn about the most popular 10 below:

Graduates earn a median salary of $36,178 in their first year after graduation. In-state undergraduate tuition runs about $4,205 a year.
Graduates earn a median salary of $28,102 in their first year after graduation. This school boasts a lower-than-average student loan default rate of 0.2%.
One year after graduating, alumni of this school earn a median of $53,819 a year. Undergrads from Ohio pay around $6,554 a year in tuition.
One year after graduating, alumni of this school earn a median of $53,614 a year. The school admits about 85% of applicants. 82% of full-time students return after their first year.
Grads earn a median early-career salary of $54,244 after earning their degree at this institution. 47% of full-time students return after their first year. In-state undergraduate tuition runs about $9,577 a year.
One year after graduating, alumni of this school earn a median of $41,713 a year. Undergrads from Ohio pay around $4,135 a year in tuition.
One year after graduating, alumni of this school earn a median of $38,408 a year. The full-time student retention rate is 100%. In-state undergraduate tuition runs about $3,435 a year.
Graduates earn a median salary of $53,819 in their first year after graduation. About 88% of those who apply are admitted. 86% of full-time students return after their first year.
Grads earn a median early-career salary of $66,002 after earning their degree at this institution. About 43% of those who apply are admitted. The full-time student retention rate is 86%.
One year after graduating, alumni of this school earn a median of $49,087 a year. The school admits about 51% of applicants. 94% of full-time students return after their first year.
Health/Medical Admin Services Careers in OH
Some of the careers Health & Medical Administrative Services majors go into include:
| Job Title | Nationwide Job Growth | Nationwide Median Salary |
|---|---|---|
| Speech-Language Pathology Assistants | 15% | $48,496 |
| Healthcare Practitioners and Technical Workers, All Other | 15% | $117,846 |
| Regulatory Affairs Specialists | 14% | $85,399 |
| Compliance Managers | 13% | $117,178 |
| Information Security Analysts | 12% | $111,930 |
| Claims Adjusters, Examiners, and Investigators | 12% | $46,655 |
| Computer Programmers | 12% | $109,892 |
| Computer User Support Specialists | 11% | $71,530 |
| Environmental Compliance Inspectors | 10% | $119,630 |
| Administrative Services Managers | 9% | $158,084 |
| Medical and Health Services Managers | 9% | $129,557 |
| Compliance Officers | 9% | $71,138 |
Related Majors in Ohio
Below are some popular majors that are similar to Health & Medical Administrative Services.
| Major | Annual Graduates Nationwide |
|---|---|
| Nursing | 311,372 |
| Nursing & Nursing Assistants | 99,987 |
| Allied Health Professions | 90,379 |
| Allied Health Services | 80,693 |
| Public Health | 41,086 |
| Health Sciences & Services | 38,201 |
| Mental & Social Health Services | 33,946 |
| Medicine | 29,737 |
View all majors related to Health/Medical Admin Services
Explore Major by State
Alabama
Arkansas
Connecticut
Florida
Hawaii
Indiana
Kentucky
Maryland
Minnesota
Montana
New Hampshire
New York
Ohio
Pennsylvania
South Carolina
Texas
Virgin Islands
West Virginia
View Nationwide Health/Medical Admin Services Report
References
More about our data sources and methodologies.
GradDegree.com provides higher-education, college and university, degree, program, career, salary, and other helpful information to students, faculty, institutions, and other internet audiences. Presented information and data are subject to change. Inclusion on this website does not imply or represent a direct relationship with the company, school, or brand. Information, though believed correct at time of publication, may not be correct, and no warranty is provided. Contact the schools to verify any information before relying on it. Financial aid may be available for those who qualify. The displayed options may include sponsored or recommended results, not necessarily based on your preferences.
© GradDegree.com – All Rights Reserved.