Doctor’s Degrees in Information Technology
Featured schools near , edit
Education Levels of IT Majors
During the most recent year for which data is available, 125 people earned their doctor's degree in it. This makes it the 110th most popular doctor's degree program in the country.
The following table shows the number of diplomas awarded in it at each degree level.
| Education Level | Number of Grads |
|---|---|
| Master’s Degree | 9,929 |
| Graduate Certificate | 1,344 |
| Doctor’s Degree | 125 |
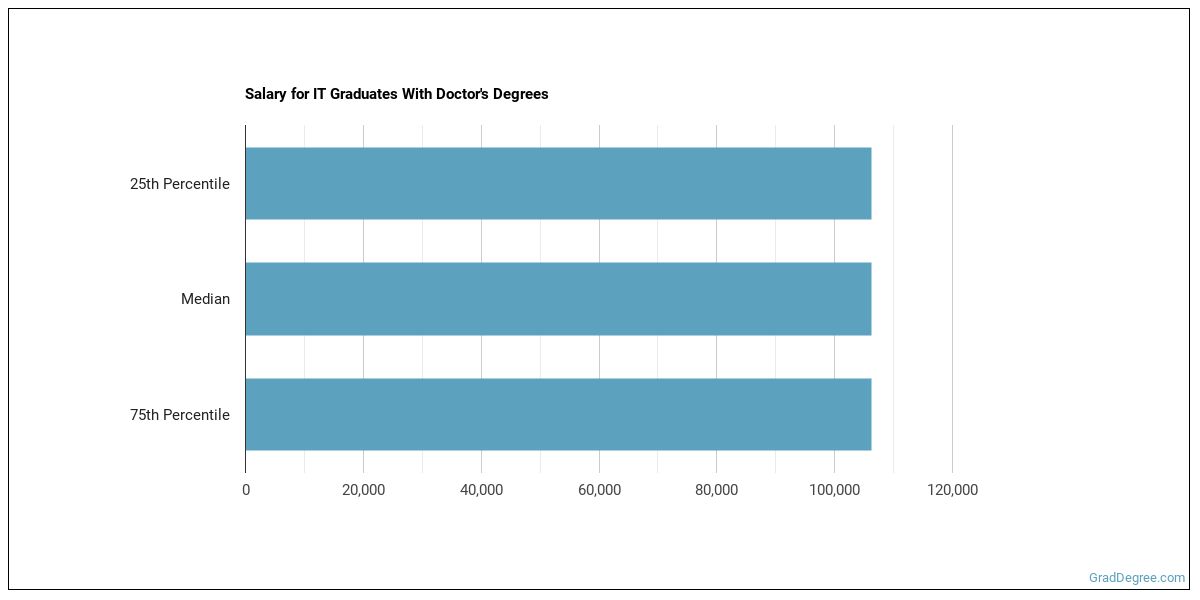
Earnings of IT Majors With Doctor’s Degrees
The median salary for graduates holding a doctor's degree in it is $106,301. This number may vary for a lot of reasons. For instance, you may decide to move to a location where people with your degree are rare and make more money. To get a better picture, earnings for this category of people can range from a low of $106,301 to a high of $106,301.
Student Debt
The median student debt for graduates holding a doctor's degree in it is $82,138. The school you go to and how long it takes you to graduate, among other things, can cause this number to vary. The chart below shows the range of accumulated debt loads. On the high side of the range, $82,138 is the debt load, and the debt load on the low side is $82,138.

Student Diversity
More men than women pursue doctor's degrees in it. About 81.6% of graduates in this field are male.
| Gender | Number of Grads |
|---|---|
| Men | 102 |
| Women | 23 |

The racial-ethnic distribution of it doctor’s degree students is as follows:
| Race/Ethnicity | Number of Grads |
|---|---|
| Asian | 6 |
| Black or African American | 46 |
| Hispanic or Latino | 13 |
| White | 45 |
| International Students | 5 |
| Other Races/Ethnicities | 10 |

Most Popular IT Programs for Doctor’s Degrees
There are 12 colleges that offer a doctor’s degree in it. Learn more about the most popular 12 below:

Capella University tops the list of the most popular school in the U.S. for it majors who are seeking their doctor's degree. Roughly 38,900 attend the school each year. The average in-state tuition for full-time undergraduates is $14,328 per year, while in-state graduate students, on average, pay $14,826 per year. During the most recent year for which we have data, 61 people received their doctor's degree in it from Capella University. Around 49% of these students were from an underrepresented racial-ethnic group, and 22% were women.

The 2nd most popular school in the country for it majors who are seeking their doctor's degree is Capitol Technology University. Each year, around 700 students seeking various degrees attend the university. The average in-state tuition for full-time undergraduates is $25,830 per year, while in-state graduate students, on average, pay $11,340 per year. During the most recent year for which we have data, 24 people received their doctor's degree in it from Capitol Tech. Around 58% of these students were from an underrepresented racial-ethnic group, and 13% were women.

Marymount University is the 3rd most popular school in the nation for students seeking a doctor's degree in it. Each year, around 3,200 students seeking various degrees attend the university. The average in-state tuition for full-time undergraduates is $35,950 per year, while in-state graduate students, on average, pay $21,420 per year. During the most recent year for which we have data, 13 people received their doctor's degree in it from Marymount. About 17% of this group were women, and 67% were students from an underrepresented racial-ethnic group.

The 4th most popular school in the country for it majors who are seeking their doctor's degree is Dakota State University. Roughly 3,100 attend the school each year. The average in-state tuition for full-time undergraduates is $7,616 per year, while in-state graduate students, on average, pay $5,999 per year. During the most recent year for which we have data, 12 people received their doctor's degree in it from Dakota State. Of these students, 29% were women and 43% were members of underrepresented racial-ethnic groups.
The 5th most popular school in the country for it majors who are seeking their doctor's degree is Nova Southeastern University. The average in-state tuition for full-time undergraduates is $34,500 per year, while in-state graduate students, on average, pay $22,062 per year. During the most recent year for which we have data, 7 people received their doctor's degree in it from NUS Florida.

The 6th most popular school in the country for it majors who are seeking their doctor's degree is St. Thomas University. Roughly 5,600 attend the school each year. The average in-state tuition for full-time undergraduates is $32,600 per year, while in-state graduate students, on average, pay $14,400 per year. During the most recent year for which we have data, 3 people received their doctor's degree in it from STU. Around 88% of these students were from an underrepresented racial-ethnic group, and 25% were women.
IT Concentrations
| Major | Annual Degrees Awarded |
|---|---|
| 118 | |
| 7 |
Explore Major by State
Alabama
Arkansas
Connecticut
Florida
Idaho
Iowa
Louisiana
Massachusetts
Mississippi
Nebraska
New Jersey
North Carolina
Oklahoma
Rhode Island
Tennessee
Vermont
West Virginia
Related Majors
Below are some popular majors that are similar to it that offer doctor’s degrees.
| Major | Annual Degrees Awarded |
|---|---|
| 1,450 | |
| 1,013 | |
| 184 | |
| 17 | |
| 8 |
References
*The racial-ethnic minority student count is calculated by taking the total number of students and subtracting white students, international students, and students whose race/ethnicity was unknown. This number is then divided by the total number of students at the school to obtain the percentage of racial-ethnic minorities.
- College Factual
- National Center for Education Statistics
- O*NET Online
- Bureau of Labor Statistics
- Image Credit: By Craig Dennis under License
More about our data sources and methodologies.
Featured Schools
GradDegree.com provides higher-education, college and university, degree, program, career, salary, and other helpful information to students, faculty, institutions, and other internet audiences. Presented information and data are subject to change. Inclusion on this website does not imply or represent a direct relationship with the company, school, or brand. Information, though believed correct at time of publication, may not be correct, and no warranty is provided. Contact the schools to verify any information before relying on it. Financial aid may be available for those who qualify. The displayed options may include sponsored or recommended results, not necessarily based on your preferences.
© GradDegree.com – All Rights Reserved.