Criminal Justice & Corrections Schools in Nevada
Featured schools near , edit

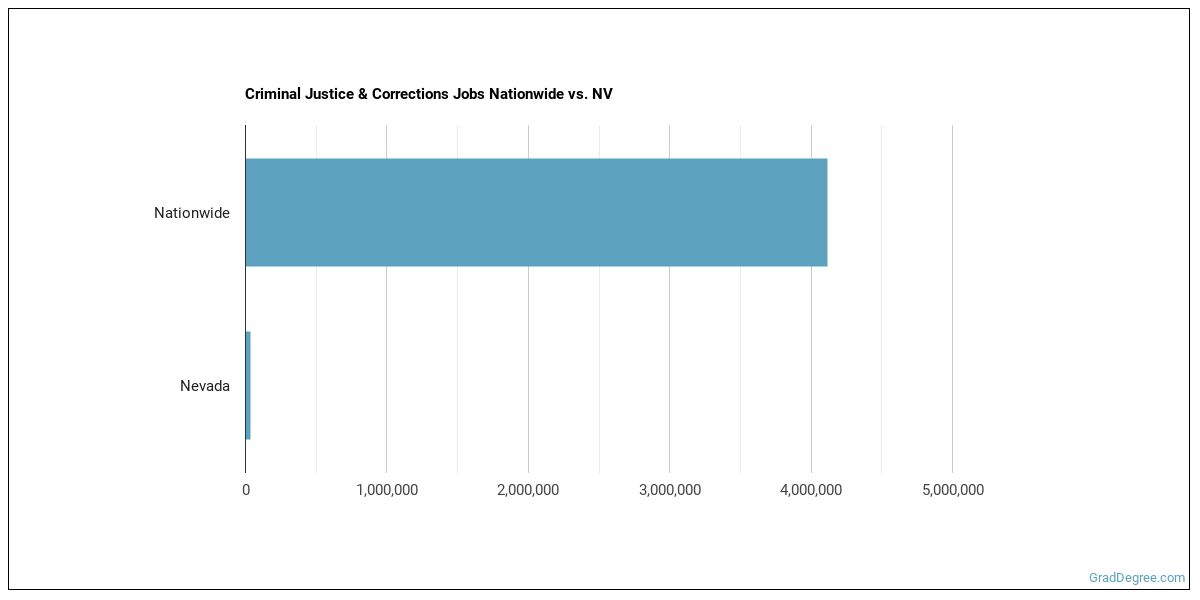
Jobs for Criminal Justice & Corrections Grads in Nevada
In this state, there are 59,700 people employed in jobs related to a Criminal Justice degree, compared to 4,342,350 nationwide.
Wages for Criminal Justice & Corrections Jobs in Nevada
In this state, Criminal Justice grads earn an average of $70,319. Nationwide, they make an average of $78,064.

Most Popular Criminal Justice & Corrections Programs in NV
Our data covers 3 colleges in Nevada offering Criminal Justice degrees. Learn about the most popular 3 below:

One year after graduating, alumni of this school earn a median of $41,201 a year. With an admission rate of 96%, getting in takes some planning. 78% of full-time students return after their first year.
Graduates earn a median salary of $34,574 in their first year after graduation. Undergrads from Nevada pay around $4,110 a year in tuition.
Graduates earn a median salary of $44,846 in their first year after graduation. About 85% of those who apply are admitted. 80% of full-time students return after their first year.
Criminal Justice & Corrections Careers in NV
Some of the careers Criminal Justice majors go into include:
| Job Title | Nationwide Job Growth | Nationwide Median Salary |
|---|---|---|
| Detectives and Criminal Investigators | 14% | $64,492 |
| Regulatory Affairs Specialists | 14% | $85,399 |
| Compliance Managers | 13% | $117,178 |
| Quality Control Analysts | 13% | $53,423 |
| Emergency Management Directors | 13% | $72,305 |
| Criminal Justice and Law Enforcement Teachers, Postsecondary | 12% | $91,449 |
| First-Line Supervisors of Police and Detectives | 12% | $52,907 |
| Private Detectives and Investigators | 12% | $71,252 |
| Intelligence Analysts | 12% | $65,483 |
| Wind Energy Development Managers | 10% | $169,952 |
| Environmental Compliance Inspectors | 10% | $119,630 |
| Regulatory Affairs Managers | 10% | $77,828 |
Related Majors in Nevada
Below are some popular majors that are similar to Criminal Justice.
| Major | Annual Graduates Nationwide |
|---|---|
| Fire Protection | 15,202 |
| Security Science and Technology | 9,173 |
| Homeland Security | 6,323 |
| Other Homeland Security | 1,217 |
View all majors related to Criminal Justice & Corrections
Explore Major by State
Alabama
Arkansas
Connecticut
Florida
Hawaii
Indiana
Kentucky
Maryland
Minnesota
Montana
New Hampshire
New York
Ohio
Pennsylvania
South Carolina
Texas
Virgin Islands
West Virginia
View Nationwide Criminal Justice & Corrections Report
References
More about our data sources and methodologies.
GradDegree.com provides higher-education, college and university, degree, program, career, salary, and other helpful information to students, faculty, institutions, and other internet audiences. Presented information and data are subject to change. Inclusion on this website does not imply or represent a direct relationship with the company, school, or brand. Information, though believed correct at time of publication, may not be correct, and no warranty is provided. Contact the schools to verify any information before relying on it. Financial aid may be available for those who qualify. The displayed options may include sponsored or recommended results, not necessarily based on your preferences.
© GradDegree.com – All Rights Reserved.