Master’s Degrees in History
Featured schools near , edit
Education Levels of History Majors
During the most recent year for which data is available, 3,531 people earned their master's degree in history. This earns it the #51 spot on the list of the most popular master's degree programs in the nation.
The following table shows the number of diplomas awarded in history at each degree level.
| Education Level | Number of Grads |
|---|---|
| Master’s Degree | 3,531 |
| Doctor’s Degree | 757 |
| Graduate Certificate | 220 |
Earnings of History Majors With Master’s Degrees
The median salary for graduates holding a master's degree in history is $39,755. A lot of factors can contribute to this number, such as the location of your workplace and the availability of other perks and bonuses. A better approximation of salary is to look at the typical range of salaries. In this case the low is $30,178 and the high is $44,348.

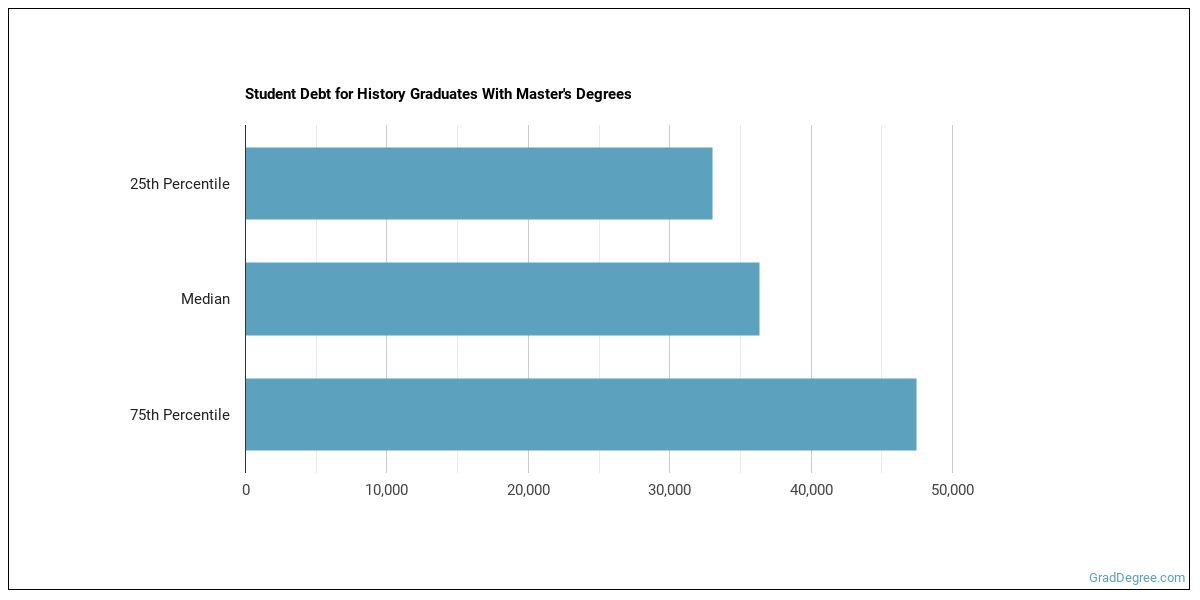
Student Debt
The median student debt for graduates holding a master's degree in history is $40,538. The school you go to and how long it takes you to graduate, among other things, can cause this number to vary. The chart below shows the range of accumulated debt loads. On the high side of the range, $40,831 is the debt load, and the debt load on the low side is $30,975.
Student Diversity
More men than women pursue master's degrees in history. About 52.1% of graduates in this field are male.
| Gender | Number of Grads |
|---|---|
| Men | 1,840 |
| Women | 1,691 |

The racial-ethnic distribution of history master’s degree students is as follows:
| Race/Ethnicity | Number of Grads |
|---|---|
| Asian | 61 |
| Black or African American | 147 |
| Hispanic or Latino | 335 |
| White | 2,525 |
| International Students | 157 |
| Other Races/Ethnicities | 306 |

Most Popular History Programs for Master’s Degrees
There are 380 colleges that offer a master’s degree in history. Learn more about the most popular 20 below:

Southern New Hampshire University tops the list of the most popular school in the U.S. for history majors who are seeking their master's degree. Each year, around 134,300 students seeking various degrees attend the university. The average in-state tuition for full-time undergraduates is $15,000 per year, while in-state graduate students, on average, pay $18,900 per year. During the most recent year for which we have data, 218 people received their master's degree in history from SNHU. Of these students, 56% were women and 17% were members of underrepresented racial-ethnic groups.

The 2nd most popular school in the country for history majors who are seeking their master's degree is American Public University System. Each year, around 50,000 students seeking various degrees attend the university. The average in-state tuition for full-time undergraduates is $6,840 per year, while in-state graduate students, on average, pay $6,660 per year. During the most recent year for which we have data, 177 people received their master's degree in history from American Military University. About 32% of this group were women, and 17% were students from an underrepresented racial-ethnic group.

Liberty University comes in at #3 on our list of the most popular colleges offering master's degrees in history. Roughly 93,300 attend the school each year. The average in-state tuition for full-time undergraduates is $15,467 per year, while in-state graduate students, on average, pay $7,893 per year. During the most recent year for which we have data, 148 people received their master's degree in history from Liberty University. Of these students, 50% were women and 9% were members of underrepresented racial-ethnic groups.
Arizona State University - Skysong is the 4th most popular school in the nation for students seeking a master's degree in history. Roughly 53,900 attend the school each year. The average in-state tuition for full-time undergraduates is $10,978 per year, while in-state graduate students, on average, pay $9,972 per year. During the most recent year for which we have data, 135 people received their master's degree in history from ASU - Skysong. Of these students, 39% were women and 12% were members of underrepresented racial-ethnic groups.

The 5th most popular school in the country for history majors who are seeking their master's degree is Pace University - New York. Roughly 12,800 attend the school each year. The average in-state tuition for full-time undergraduates is $48,152 per year, while in-state graduate students, on average, pay $25,560 per year. During the most recent year for which we have data, 120 people received their master's degree in history from Pace University. Of these students, 49% were women and 10% were members of underrepresented racial-ethnic groups.

Norwich University comes in at #6 on our list of the most popular colleges offering master's degrees in history. Each year, around 3,900 students seeking various degrees attend the university. The average in-state tuition for full-time undergraduates is $42,860 per year, while in-state graduate students, on average, pay $20,280 per year. During the most recent year for which we have data, 63 people received their master's degree in history from Norwich. Of these students, 27% were women and 15% were members of underrepresented racial-ethnic groups.

Ashland University is the 7th most popular school in the nation for students seeking a master's degree in history. Roughly 4,400 attend the school each year. The average in-state tuition for full-time undergraduates is $23,000 per year, while in-state graduate students, on average, pay $7,656 per year. During the most recent year for which we have data, 57 people received their master's degree in history from Ashland. Of these students, 50% were women and 9% were members of underrepresented racial-ethnic groups.

Yale University comes in at #8 on our list of the most popular colleges offering master's degrees in history. Roughly 12,000 attend the school each year. The average in-state tuition for full-time undergraduates is $62,250 per year, while in-state graduate students, on average, pay $46,900 per year. During the most recent year for which we have data, 55 people received their master's degree in history from Yale. About 49% of this group were women, and 25% were students from an underrepresented racial-ethnic group.

Columbia University in the City of New York comes in at #9 on our list of the most popular colleges offering master's degrees in history. Each year, around 30,100 students seeking various degrees attend the university. The average in-state tuition for full-time undergraduates is $61,989 per year, while in-state graduate students, on average, pay $52,016 per year. During the most recent year for which we have data, 53 people received their master's degree in history from Columbia. Of these students, 53% were women and 25% were members of underrepresented racial-ethnic groups.

New York University comes in at #10 on our list of the most popular colleges offering master's degrees in history. Roughly 52,700 attend the school each year. The average in-state tuition for full-time undergraduates is $55,384 per year, while in-state graduate students, on average, pay $37,332 per year. During the most recent year for which we have data, 50 people received their master's degree in history from NYU. Of these students, 64% were women and 24% were members of underrepresented racial-ethnic groups.

Harvard University comes in at #11 on our list of the most popular colleges offering master's degrees in history. Each year, around 30,300 students seeking various degrees attend the university. The average in-state tuition for full-time undergraduates is $52,659 per year, while in-state graduate students, on average, pay $52,456 per year. During the most recent year for which we have data, 42 people received their master's degree in history from Harvard. Around 34% of these students were from an underrepresented racial-ethnic group, and 51% were women.

The 12th most popular school in the country for history majors who are seeking their master's degree is Missouri State University - Springfield. Each year, around 23,500 students seeking various degrees attend the university. The average in-state tuition for full-time undergraduates is $7,476 per year, while in-state graduate students, on average, pay $5,994 per year. During the most recent year for which we have data, 36 people received their master's degree in history from Missouri State. About 46% of this group were women, and 12% were students from an underrepresented racial-ethnic group.

Sam Houston State University is the 13th most popular school in the nation for students seeking a master's degree in history. Roughly 21,900 attend the school each year. The average in-state tuition for full-time undergraduates is $5,856 per year, while in-state graduate students, on average, pay $5,765 per year. During the most recent year for which we have data, 34 people received their master's degree in history from SHSU. Of these students, 60% were women and 24% were members of underrepresented racial-ethnic groups.

The 14th most popular school in the country for history majors who are seeking their master's degree is University of Nebraska at Kearney. Each year, around 6,200 students seeking various degrees attend the university. The average in-state tuition for full-time undergraduates is $6,270 per year, while in-state graduate students, on average, pay $6,216 per year. During the most recent year for which we have data, 29 people received their master's degree in history from UNK. Around 25% of these students were from an underrepresented racial-ethnic group, and 42% were women.

George Mason University is the 14th most popular school in the nation for students seeking a master's degree in history. Roughly 38,500 attend the school each year. The average in-state tuition for full-time undergraduates is $9,795 per year, while in-state graduate students, on average, pay $13,426 per year. During the most recent year for which we have data, 29 people received their master's degree in history from GMU. Around 22% of these students were from an underrepresented racial-ethnic group, and 52% were women.

The 16th most popular school in the country for history majors who are seeking their master's degree is The Graduate Center, CUNY. Each year, around 9,300 students seeking various degrees attend the university. The average in-state tuition for full-time undergraduates is $6,930 per year, while in-state graduate students, on average, pay $9,930 per year. During the most recent year for which we have data, 28 people received their master's degree in history from The Graduate Center. Of these students, 50% were women and 3% were members of underrepresented racial-ethnic groups.

The 17th most popular school in the country for history majors who are seeking their master's degree is Simmons University. Each year, around 6,200 students seeking various degrees attend the university. The average in-state tuition for full-time undergraduates is $43,060 per year, while in-state graduate students, on average, pay $27,152 per year. During the most recent year for which we have data, 27 people received their master's degree in history from Simmons.
California State University - Fullerton is the 18th most popular school in the nation for students seeking a master's degree in history. Roughly 42,000 attend the school each year. The average in-state tuition for full-time undergraduates is $5,742 per year, while in-state graduate students, on average, pay $7,176 per year. During the most recent year for which we have data, 25 people received their master's degree in history from Cal State Fullerton. Of these students, 45% were women and 42% were members of underrepresented racial-ethnic groups.

The 18th most popular school in the country for history majors who are seeking their master's degree is University of North Carolina at Wilmington. Roughly 17,900 attend the school each year. The average in-state tuition for full-time undergraduates is $4,443 per year, while in-state graduate students, on average, pay $4,719 per year. During the most recent year for which we have data, 25 people received their master's degree in history from UNCW. Around 11% of these students were from an underrepresented racial-ethnic group, and 39% were women.

California State University - Los Angeles is the 20th most popular school in the nation for students seeking a master's degree in history. Each year, around 26,700 students seeking various degrees attend the university. The average in-state tuition for full-time undergraduates is $5,742 per year, while in-state graduate students, on average, pay $7,176 per year. During the most recent year for which we have data, 24 people received their master's degree in history from Cal State LA. Of these students, 53% were women and 76% were members of underrepresented racial-ethnic groups.
History Concentrations
| Major | Annual Degrees Awarded |
|---|---|
| 3,130 | |
| 128 | |
| 86 | |
| 80 | |
| 70 |
Explore Major by State
Alabama
Arkansas
Connecticut
Florida
Idaho
Iowa
Louisiana
Massachusetts
Mississippi
Nebraska
New Jersey
North Carolina
Oklahoma
Rhode Island
Tennessee
Vermont
West Virginia
References
*The racial-ethnic minority student count is calculated by taking the total number of students and subtracting white students, international students, and students whose race/ethnicity was unknown. This number is then divided by the total number of students at the school to obtain the percentage of racial-ethnic minorities.
More about our data sources and methodologies.
Featured Schools
 Request Info
|
Southern New Hampshire University You have goals. Southern New Hampshire University can help you get there. Whether you need a bachelor's degree to get into a career or want a master's degree to move up in your current career, SNHU has an online program for you. Find your degree from over 200 online programs. Learn More > |
GradDegree.com provides higher-education, college and university, degree, program, career, salary, and other helpful information to students, faculty, institutions, and other internet audiences. Presented information and data are subject to change. Inclusion on this website does not imply or represent a direct relationship with the company, school, or brand. Information, though believed correct at time of publication, may not be correct, and no warranty is provided. Contact the schools to verify any information before relying on it. Financial aid may be available for those who qualify. The displayed options may include sponsored or recommended results, not necessarily based on your preferences.
© GradDegree.com – All Rights Reserved.