General Engineering Schools in Kentucky
Featured schools near , edit
Jobs for General Engineering Grads in Kentucky
2,850 people in the state and 367,850 in the nation are employed in jobs related to engineering.

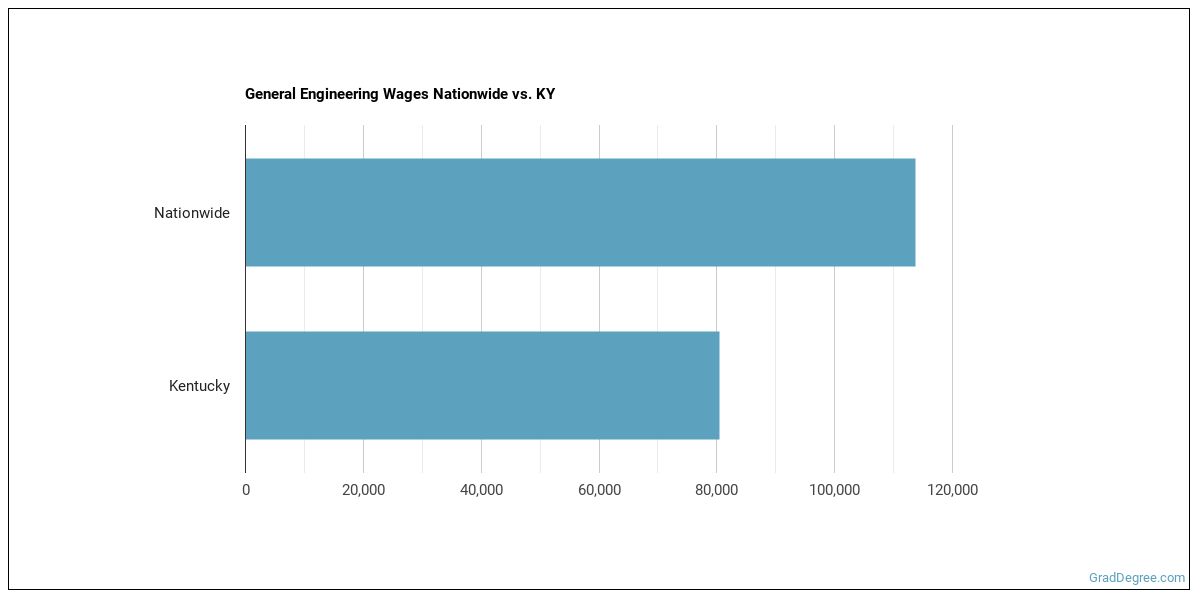
Wages for General Engineering Jobs in Kentucky
In this state, engineering grads earn an average of $80,500. Nationwide, they make an average of $113,680.
General Engineering Careers in KY
Some of the careers engineering majors go into include:
| Job Title | KY Job Growth | KY Median Salary |
|---|---|---|
| Engineering Professors | 12% | $79,380 |
| Engineers | 11% | $76,910 |
| Architectural and Engineering Managers | 3% | $114,650 |
Related Majors in Kentucky
Below are some popular majors in the state that are similar to engineering.
| Major | Annual Graduates in KY |
|---|---|
| Mechanical Engineering | 61 |
| Civil Engineering | 58 |
| Computer Engineering | 45 |
| Electrical Engineering | 41 |
| Biomedical Engineering | 21 |
| Industrial Engineering | 13 |
| Agricultural Engineering | 10 |
| Mining Engineering | 6 |
View all majors related to General Engineering
Explore Major by State
Alabama
Arkansas
Connecticut
Florida
Idaho
Iowa
Louisiana
Massachusetts
Mississippi
Nebraska
New Jersey
North Carolina
Oklahoma
Rhode Island
Tennessee
Vermont
West Virginia
View Nationwide General Engineering Report
References
- College Factual
- National Center for Education Statistics
- O*NET Online
- Image Credit: By Rémi Kaupp under License
More about our data sources and methodologies.
Featured Schools
GradDegree.com provides higher-education, college and university, degree, program, career, salary, and other helpful information to students, faculty, institutions, and other internet audiences. Presented information and data are subject to change. Inclusion on this website does not imply or represent a direct relationship with the company, school, or brand. Information, though believed correct at time of publication, may not be correct, and no warranty is provided. Contact the schools to verify any information before relying on it. Financial aid may be available for those who qualify. The displayed options may include sponsored or recommended results, not necessarily based on your preferences.
© GradDegree.com – All Rights Reserved.