Transportation & Materials Moving
Instructional programs that prepare individuals to apply technical knowledge and skills to perform tasks and services that facilitate the movement of people or materials.
Featured schools near , edit
Types of Degrees Transportation & Materials Moving Majors Are Earning
People majoring in Transportation & Materials Moving can earn degrees at several award levels.
| Award Level | Graduates |
|---|---|
| Certificate | 1,396 |
| Associate’s Degree | 1,939 |
| Bachelor’s Degree | 7,392 |
| Master’s Degree | 14,402 |
| Doctor’s Degree | 28 |
What Transportation & Materials Moving Majors Need to Know
Coursework for Transportation & Materials Moving develop a specific mix of knowledge, skills, and abilities — derived from O*NET surveys of workers in occupations that Transportation & Materials Moving graduates commonly enter.
Knowledge Areas
Coursework in Transportation & Materials Moving emphasizes the following knowledge areas:

- Transportation — Importance 3.8 / 5; level 4.0 / 7.
- Public Safety and Security — Importance 3.6 / 5; level 3.6 / 7.
- English Language — Importance 3.5 / 5; level 3.3 / 7.
- Customer and Personal Service — Importance 3.4 / 5; level 3.8 / 7.
- Mechanical — Importance 3.2 / 5; level 3.6 / 7.
Importance is rated 1–5; level is 1–7. Source: ONET Online — weighted across related occupations.*
Skills
Skills built by a Transportation & Materials Moving program reflects the day-to-day work of related occupations:
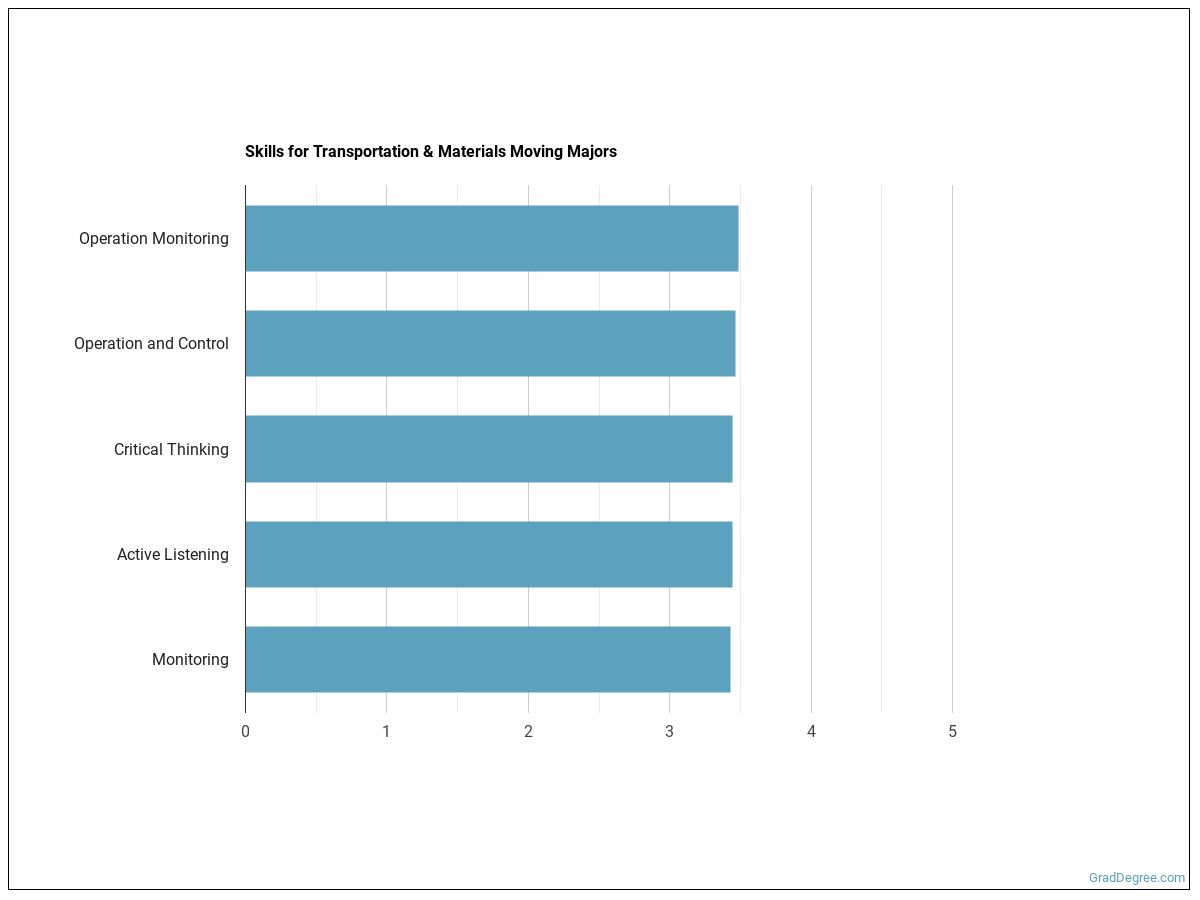
- Operation and Control — Importance 3.6 / 5; level 3.5 / 7.
- Operations Monitoring — Importance 3.6 / 5; level 3.4 / 7.
- Monitoring — Importance 3.5 / 5; level 3.4 / 7.
- Active Listening — Importance 3.4 / 5; level 3.2 / 7.
- Critical Thinking — Importance 3.4 / 5; level 3.3 / 7.
Abilities
Innate abilities most relevant to Transportation & Materials Moving careers — again drawn from O*NET surveys of related occupations:
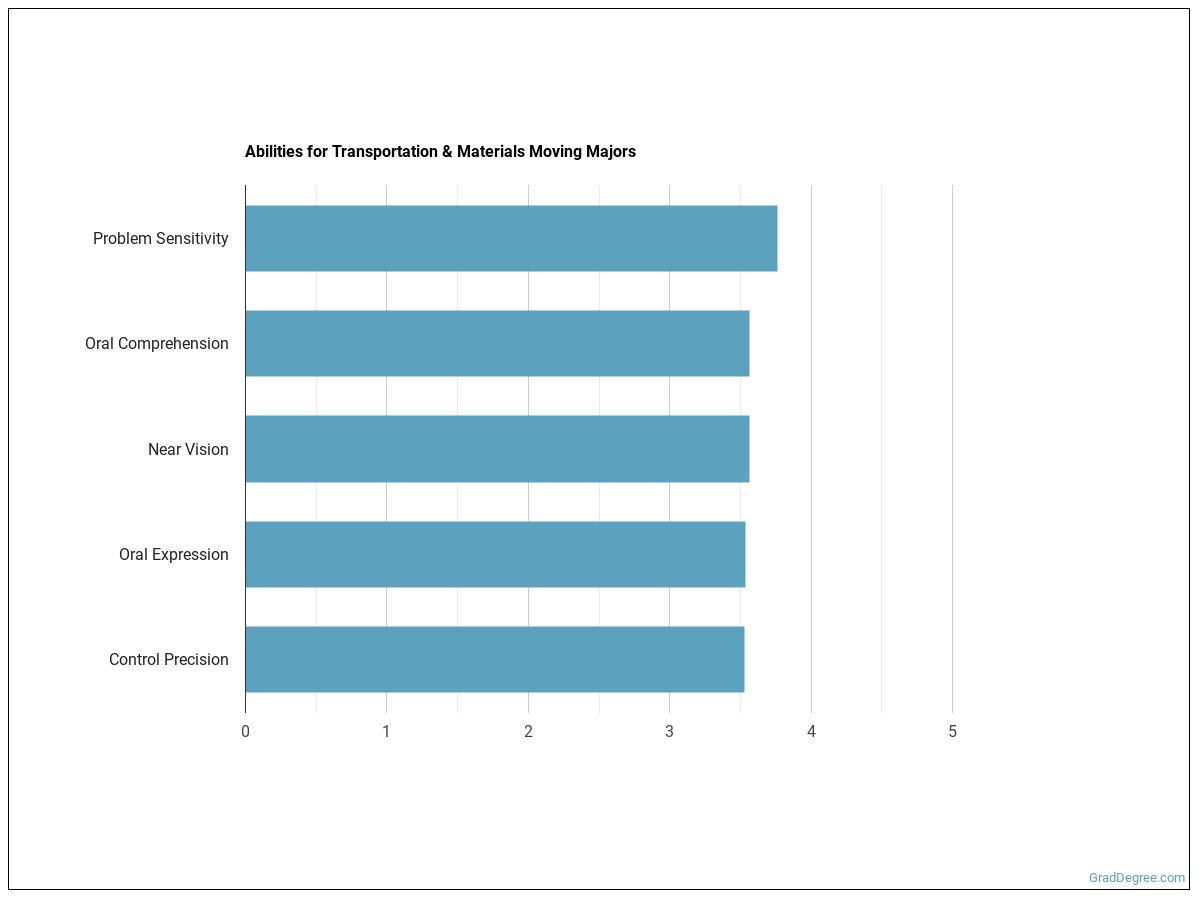
- Problem Sensitivity — Importance 3.8 / 5; level 3.6 / 7.
- Control Precision — Importance 3.7 / 5; level 3.6 / 7.
- Far Vision — Importance 3.7 / 5; level 3.9 / 7.
- Near Vision — Importance 3.6 / 5; level 3.4 / 7.
- Oral Comprehension — Importance 3.6 / 5; level 3.7 / 7.
Common Job Activities
Day-to-day, Transportation & Materials Moving graduates report doing:
| Activity | Frequency / Importance |
|---|---|
| Inspecting Equipment, Structures, or Materials | 4.2 / 7 |
| Operating Vehicles, Mechanized Devices, or Equipment | 4.2 / 7 |
| Getting Information | 4.2 / 7 |
| Identifying Objects, Actions, and Events | 4.2 / 7 |
| Making Decisions and Solving Problems | 4.1 / 7 |
| Monitoring Processes, Materials, or Surroundings | 4.0 / 7 |
| Communicating with Supervisors, Peers, or Subordinates | 4.0 / 7 |
| Evaluating Information to Determine Compliance with Standards | 3.8 / 7 |
| Controlling Machines and Processes | 3.8 / 7 |
| Updating and Using Relevant Knowledge | 3.6 / 7 |
Technology Skills Used on the Job
Most frequently-cited tools used by Transportation & Materials Moving professionals:
| Tool / Software | Category | In-Demand |
|---|---|---|
| Microsoft Office software | Office suite software | ✓ |
| Microsoft Excel | Spreadsheet software | ✓ |
| Microsoft Outlook | Electronic mail software | ✓ |
| Microsoft Word | Word processing software | ✓ |
| Microsoft PowerPoint | Presentation software | ✓ |
| Web browser software | Internet browser software | — |
| Microsoft Windows | Operating system software | — |
| Global positioning system GPS software | Mobile location based services software | — |
| SAP software | Enterprise resource planning ERP software | ✓ |
| Word processing software | Word processing software | — |
| Microsoft Access | Data base user interface and query software | — |
| Microsoft Visio | Process mapping and design software | — |
Source: ONET Online technology skills, weighted across related occupations.*
Sample Job Titles
Real job postings for Transportation & Materials Moving graduates include:
- Line Pilot
- Pilot
- Captain
- Speedboat Driver
- River Pilot
- Boat Operator
- Harbor Pilot
- Bus Driver
- Copilot
- Helicopter Pilot
- First Officer Pilot (FO Pilot)
- Airplane Pilot
- Check Airman
- Launch Operator
- River and Lakes Boatman
What Can You Do With a Transportation & Materials Moving Degree?
Graduates with a degree in Transportation & Materials Moving commonly enter the following occupations:
| Occupation | Job Growth | Median Salary | 25th–75th Pctile |
|---|---|---|---|
| Logging Equipment Operators | -4.2% | $36,164 | $29,281–$43,048 |
Job-growth = projected employment change for the parent occupation. Source: ONET / BLS Employment Projections.*
Education Typically Required
Across the occupations open to Transportation & Materials Moving graduates, the typical level of education actually held by current workers is distributed as:
| Education Level | Share of Workers |
|---|---|
| High school diploma or equivalent | 53.1% |
| Less than a high school diploma | 12.3% |
| Bachelor’s degree | 12.2% |
| Postsecondary certificate | 12.1% |
| Some college courses | 6.6% |
| Associate’s degree (or other 2-year) | 2.2% |
| Post-baccalaureate certificate | 0.7% |
| Master’s degree | 0.6% |
| Post-doctoral training | 0.1% |

Source: ONET Online education / training / experience requirements.*
Who Is Earning a Degree in Transportation & Materials Moving?
Gender Distribution
This field skews predominantly male, with men earning 85.5% of Transportation & Materials Moving degrees.
| Gender | Graduates | Share |
|---|---|---|
| Women | 5,092 | 14.5% |
| Men | 30,138 | 85.5% |
Racial-Ethnic Diversity
At the national level, the racial-ethnic distribution of Transportation & Materials Moving graduates is as follows:

| Race / Ethnicity | Graduates | Share |
|---|---|---|
| White | 16,351 | 46.4% |
| Asian | 663 | 1.9% |
| Hispanic or Latino | 5,149 | 14.6% |
| Black or African American | 8,757 | 24.9% |
| American Indian / Alaska Native | 505 | 1.4% |
| Native Hawaiian / Pacific Islander | 83 | 0.2% |
| Two or More Races | 1,059 | 3.0% |
| Race Unknown | 1,543 | 4.4% |
| International Students | 1,120 | 3.2% |
See minority definition below.
How Much Do Transportation & Materials Moving Graduates Earn?
Federal data tracks median earnings of Transportation & Materials Moving graduates 1, 4, and 5 years after completion. These numbers tend to grow steadily as graduates gain experience and move into mid-career roles.
| Years Out | Median Earnings |
|---|---|
| 1 year | $46,954 |
| 4 years | $50,366 |
| 5 years | $56,178 |
By year 5 out, median earnings rise to $56,178 — roughly 20% above the 1-year mark.
Source: U.S. Department of Education College Scorecard, field-of-study earnings tracker.
Online Transportation & Materials Moving Programs
Distance learning is tracked by IPEDS for Transportation & Materials Moving. The table below shows how many graduates earned at least some of their coursework online (Distance-Ed Available) versus completing the entire program online (Distance-Ed Only).
| Award Level | Distance-Ed Available | Distance-Ed Only |
|---|---|---|
| Associate’s | 9 | 10 |
| Bachelor’s | 23 | 21 |
| Master’s | 20 | 3 |
| Doctoral (Research) | 4 | 1 |
Distance-Ed Only = degrees completed entirely online; Distance-Ed Available = degrees including at least some online coursework. Source: IPEDS Completions by Distance Education status.
Is a Degree in Transportation & Materials Moving Worth It?
Looking purely at the federal earnings tracker, Transportation & Materials Moving graduates earn a median of $50,366 four years after completion — roughly 33% above the national median for workers with only a high school diploma (~$38,000).
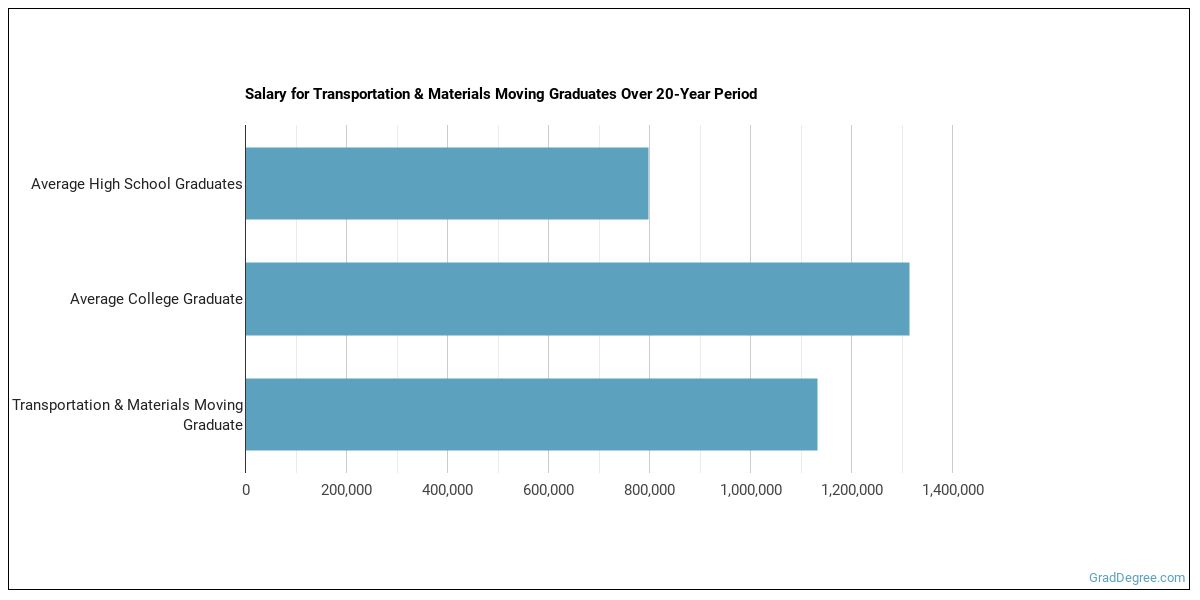
ROI estimate compares the program’s 4-yr median earnings against the 2023 BLS CPS median earnings for high-school-only workers. Source: U.S. Department of Education College Scorecard + BLS Current Population Survey.
Explore Transportation & Materials Moving by State
Alabama
California
District of Columbia
Idaho
Kansas
Maryland
Mississippi
Nevada
New York
Oklahoma
South Carolina
Utah
West Virginia
Alaska
Colorado
Florida
Illinois
Kentucky
Massachusetts
Missouri
New Hampshire
North Carolina
Oregon
South Dakota
Vermont
Wisconsin
References
The racial-ethnic minorities count is calculated by taking the total number of students and subtracting white students and international students. This number is then divided by the total number of students to obtain the racial-ethnic minorities percentage.
- College Factual
- National Center for Education Statistics (IPEDS)
- O*NET Online
- U.S. Bureau of Labor Statistics
- U.S. Department of Education College Scorecard
More about our data sources and methodologies.
GradDegree.com provides higher-education, college and university, degree, program, career, salary, and other helpful information to students, faculty, institutions, and other internet audiences. Presented information and data are subject to change. Inclusion on this website does not imply or represent a direct relationship with the company, school, or brand. Information, though believed correct at time of publication, may not be correct, and no warranty is provided. Contact the schools to verify any information before relying on it. Financial aid may be available for those who qualify. The displayed options may include sponsored or recommended results, not necessarily based on your preferences.
© GradDegree.com – All Rights Reserved.