Wright State University - Lake Campus Graduate Programs
Wright State University - Lake Campus is a public institution situated in Celina, Ohio. Wright State University - Lake Campus is located in the countryside, which is perfect for students who enjoy a rural lifestyle.
Featured schools near , edit
Where Is Wright State University - Lake Campus?

Contact details for Wright State University - Lake Campus are given below.
| Contact Details | |
|---|---|
| Address: | 7600 Lake Campus Drive, Celina, OH 45822-2952 |
| Phone: | 419-586-0300 |
| Website: | lake.wright.edu |
Wright State University - Lake Campus Graduate Student Diversity
Gender Diversity
Of the 9 graduate students at Wright State University - Lake Campus, 33% are male and 67% are female.

Racial-Ethnic Diversity
The racial-ethnic breakdown of Wright State University - Lake Campus graduate students is as follows.
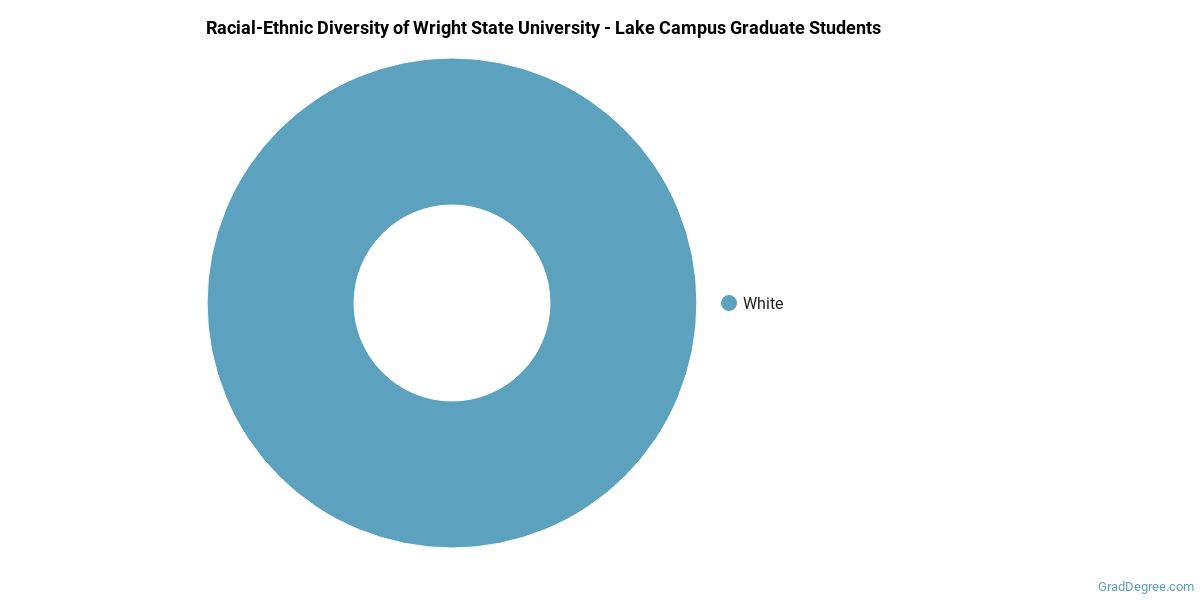
| Race/Ethnicity | Number of Grads |
|---|---|
| Asian | 0 |
| Black or African American | 0 |
| Hispanic or Latino | 0 |
| White | 9 |
| International Students | 0 |
| Other Races/Ethnicities | 0 |
Geographic Diversity
Ohio students aren't the only ones who study at Wright State University - Lake Campus. At this time, 7 states are represented by the student population at the school.
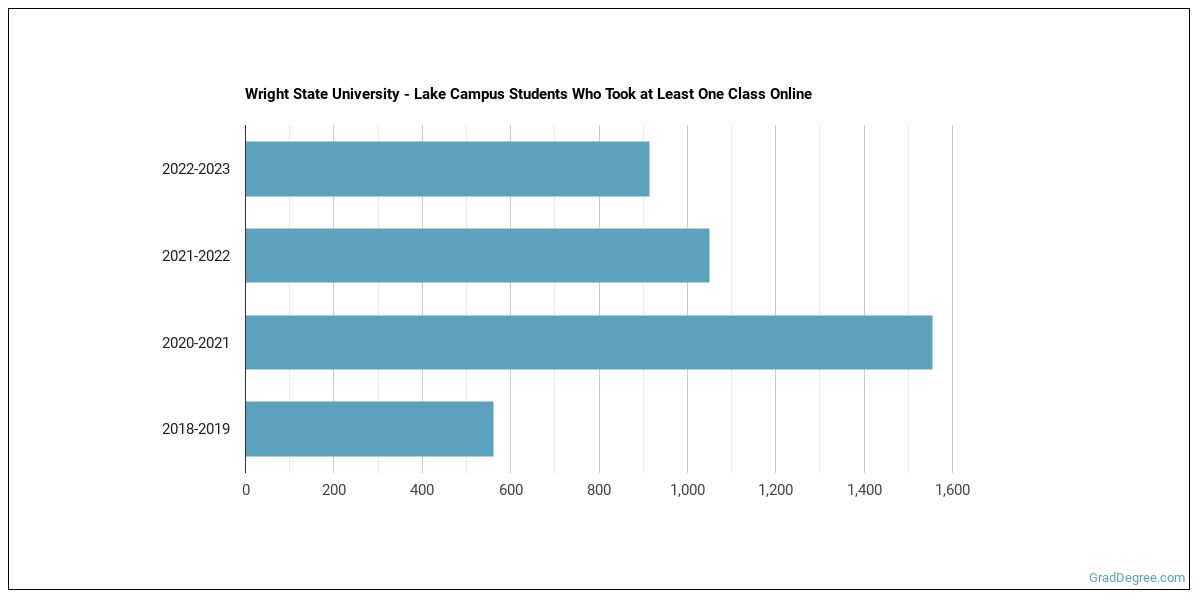
Online Learning at Wright State University - Lake Campus
The following chart shows how the online learning population at Wright State University - Lake Campus has changed over the last few years.
The following table shows the 1-year growth rate of Wright State University - Lake Campus majors that offer at least one online course. This table only includes majors with positive growth.
| Major | 1-Year Growth Rate |
|---|---|
| Visual & Performing Arts | 57% |
Wright State University - Lake Campus Graduate Concentrations
The table below shows the number of awards for each concentration.
References
*The racial-ethnic minorities count is calculated by taking the total number of students and subtracting white students, international students, and students whose race/ethnicity was unknown. This number is then divided by the total number of students at the school to obtain the racial-ethnic minorities percentage.
More about our data sources and methodologies.
Featured Schools
 Request Info
|
Southern New Hampshire University You have goals. Southern New Hampshire University can help you get there. Whether you need a bachelor's degree to get into a career or want a master's degree to move up in your current career, SNHU has an online program for you. Find your degree from over 200 online programs. Learn More > |
GradDegree.com provides higher-education, college and university, degree, program, career, salary, and other helpful information to students, faculty, institutions, and other internet audiences. Presented information and data are subject to change. Inclusion on this website does not imply or represent a direct relationship with the company, school, or brand. Information, though believed correct at time of publication, may not be correct, and no warranty is provided. Contact the schools to verify any information before relying on it. Financial aid may be available for those who qualify. The displayed options may include sponsored or recommended results, not necessarily based on your preferences.
© GradDegree.com – All Rights Reserved.