Bellevue University Graduate Programs
Located in Bellevue, Nebraska, Bellevue University is a private not-for-profit institution. Bellevue University is located in a safe and convenient suburb.
Featured schools near , edit

Bellevue University Rankings
Our rankings are based on an outcomes-based approach rather than subjective ones used by other media outlets. As such, we utilize data from the Integrated Postsecondary Education Data System (IPEDS) and the College Scorecard, among other sources. Visit our rankings and methodology section to learn more.
Program Level Awards
These are highlights of some of the most noteworthy awards granted to specific programs at Bellevue University.
Awards From Around the Web
The following table lists some notable awards Bellevue University has earned from around the web.
Rank | Ranking Name | Source |
---|---|---|
#1 | Best Business Support & Assistant Services Schools | College Factual |
#1 | Best Other Management Information Systems and Services Schools | College Factual |
#13 | Best Management Information Systems Schools | College Factual |
#74 | Best Business Administration & Management Schools | College Factual |
#116 | Best Schools | Course Advisor |
#136 | Best Business, Management & Marketing Schools | College Factual |
Where Is Bellevue University?

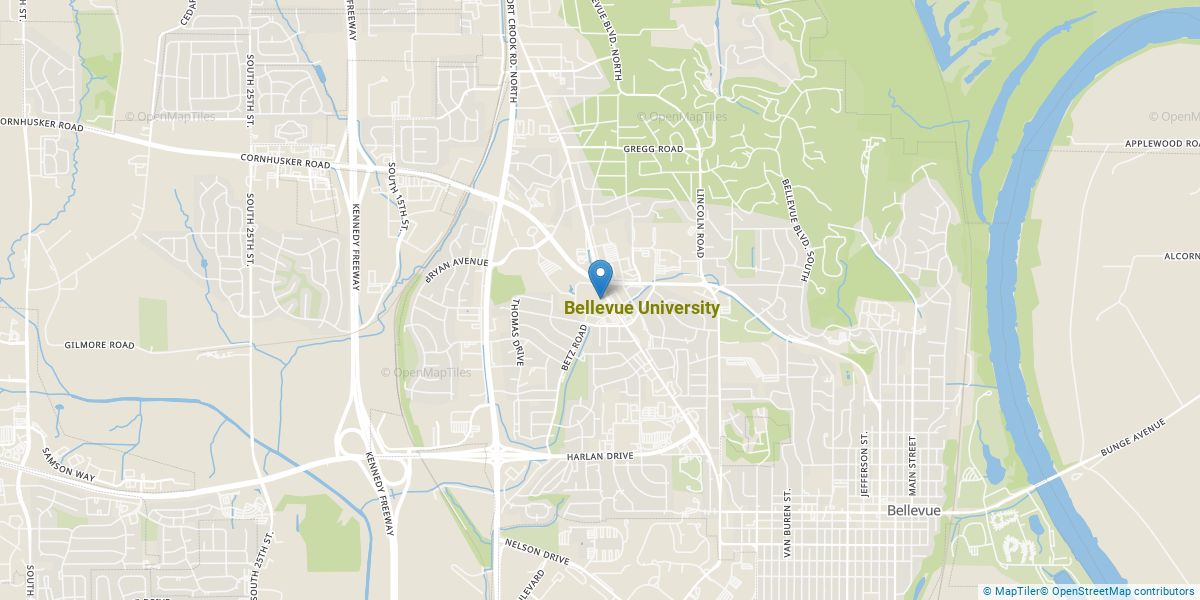
Contact details for Bellevue University are given below.
Contact Details | |
---|---|
Address: | 1000 Galvin Rd S, Bellevue, NE 68005-3098 |
Phone: | 402-291-8100 |
Website: | www.bellevue.edu |
Facebook: | https://www.facebook.com/BellevueUniversity |
Twitter: | https://twitter.com/BellevueU |
Bellevue University Graduate Student Diversity
Gender Diversity
Of the 3,394 graduate students at Bellevue University, 44% are male and 56% are female.

Racial-Ethnic Diversity
The racial-ethnic breakdown of Bellevue University graduate students is as follows.

Race/Ethnicity | Number of Grads |
---|---|
Asian | 177 |
Black or African American | 365 |
Hispanic or Latino | 403 |
White | 1,774 |
International Students | 9 |
Other Races/Ethnicities | 666 |
Geographic Diversity
Nebraska students aren't the only ones who study at Bellevue University. At this time, 10 states are represented by the student population at the school.
Over 42 countries are represented at Bellevue University. The most popular countries sending students to the school are India, China, and Nepal.
Online Learning at Bellevue University
The following chart shows how the online learning population at Bellevue University has changed over the last few years.

This school is the most popular in Nebraska for online learning according to the online graduations recorded by the Department of Education for the academic year 2019-2020.
Online Affordability Rankings of Bellevue University
During the most recent year for which we have data, the full-time graduate tuition at Bellevue University was $9,900 for both in-state and out-of-state students. The following table shows how Bellevue University is ranked for affordability for both in-state and out-of-state students among colleges and universities that are mostly online.
Major | Tuition for In-State Students | Tuition for Out-of-State Students |
---|---|---|
English Language & Literature | #1 | #1 |
General English Literature | #1 | #1 |
General Social Sciences | #1 | #1 |
Fine & Studio Arts | #1 | #1 |
Finance & Financial Management | #4 | #4 |
Information Science | #4 | #1 |
Human Services | #4 | #4 |
Visual & Performing Arts | #4 | #4 |
Management Sciences & Quantitative Methods | #7 | #7 |
Marketing | #7 | #7 |
Communication & Journalism | #7 | #4 |
Public Relations & Advertising | #7 | #7 |
International Relations & National Security | #7 | #7 |
General Business/Commerce | #10 | #7 |
Education | #10 | #10 |
Homeland Security | #10 | #10 |
Human Resource Management | #12 | #12 |
Information Technology | #13 | #10 |
Mental & Social Health Services | #13 | #10 |
Public Administration & Social Service | #16 | #16 |
Public Administration | #16 | #16 |
Computer Information Systems | #18 | #18 |
Health & Medical Administrative Services | #18 | #15 |
Accounting | #19 | #19 |
Clinical, Counseling & Applied Psychology | #25 | #25 |
Health Professions | #28 | #28 |
Psychology | #29 | #26 |
Instructional Media Design | #51 | #30 |
Online Growth Rankings of Bellevue University
The average growth rate over the last four years of online students at Bellevue University was 15.2%. This is the #348 largest growth rate of all schools that are mostly online. This refers to all students at Bellevue University regardless of major.
The following table shows the 1-year growth rate of Bellevue University majors that offer at least one online course. This table only includes majors with positive growth.
Major | 1-Year Growth Rate |
---|---|
Clinical, Counseling & Applied Psychology | 57% |
Communication & Journalism | 17% |
Instructional Media Design | 44% |
Management Sciences & Quantitative Methods | 56% |
Psychology | 26% |
Public Administration | 23% |
Public Relations & Advertising | 46% |
The table below shows how the average growth rate over 4 years at Bellevue University ranks compared to all other mostly online schools that offer a specific major. Note that the majors may or may not be offered online at Bellevue University.
When we speak of partially online, we are referring to schools whose online population is less than 50% of its total student body. Mostly online refers to those with online populations greater than or equal to 50%.
Bellevue University Graduate Concentrations
The table below shows the number of awards for each concentration.
Major | Master’s | Doctor’s | TOTAL |
---|---|---|---|
Business Administration & Management | 361 | 0 | 361 |
General Social Sciences | 115 | 0 | 115 |
Management Sciences & Quantitative Methods | 113 | 0 | 113 |
Information Technology | 91 | 0 | 91 |
Human Resource Management | 77 | 10 | 87 |
Clinical, Counseling & Applied Psychology | 82 | 0 | 82 |
Information Science | 64 | 0 | 64 |
Health & Medical Administrative Services | 44 | 0 | 44 |
Public Relations & Advertising | 41 | 0 | 41 |
Computer Information Systems | 38 | 0 | 38 |
Criminal Justice & Corrections | 30 | 0 | 30 |
Public Administration | 30 | 0 | 30 |
Marketing | 16 | 0 | 16 |
Finance & Financial Management | 15 | 0 | 15 |
Accounting | 12 | 0 | 12 |
Instructional Media Design | 9 | 0 | 9 |
International Relations & National Security | 5 | 0 | 5 |
General Business/Commerce | 3 | 0 | 3 |
General English Literature | 1 | 0 | 1 |
Mental & Social Health Services | 1 | 0 | 1 |
Homeland Security | 0 | 0 | 0 |
Human Services | 0 | 0 | 0 |
Fine & Studio Arts | 0 | 0 | 0 |
TOTAL | 1,148 | 10 | 1,158 |
References
*The racial-ethnic minorities count is calculated by taking the total number of students and subtracting white students, international students, and students whose race/ethnicity was unknown. This number is then divided by the total number of students at the school to obtain the racial-ethnic minorities percentage.
- College Factual
- National Center for Education Statistics
- Image Credit: By Infodegestion under License
More about our data sources and methodologies.
Featured Schools
![]() |
Southern New Hampshire University You have goals. Southern New Hampshire University can help you get there. Whether you need a bachelor's degree to get into a career or want a master's degree to move up in your current career, SNHU has an online program for you. Find your degree from over 200 online programs. Learn More > |