Aspen University Graduate Programs
Aspen University is a private for-profit institution situated in Phoenix, Arizona. The location of the school is great for students who enjoy the amenities of city life.
Featured schools near , edit
Where Is Aspen University?

Contact details for Aspen University are given below.
| Contact Details | |
|---|---|
| Address: | 4615 E. Elwood St., Suite 100, Phoenix, AZ 85040 |
| Phone: | 303-333-4224 |
| Website: | www.aspen.edu |
Aspen University Graduate Student Diversity
Gender Diversity
Of the 3,604 graduate students at Aspen University, 17% are male and 83% are female.

Racial-Ethnic Diversity
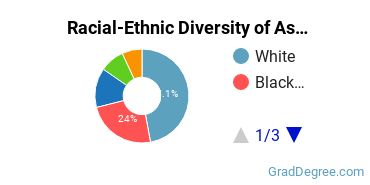
The racial-ethnic breakdown of Aspen University graduate students is as follows.

| Race/Ethnicity | Number of Grads |
|---|---|
| Asian | 305 |
| Black or African American | 864 |
| Hispanic or Latino | 250 |
| White | 1,697 |
| International Students | 0 |
| Other Races/Ethnicities | 488 |
Geographic Diversity
Arizona students aren't the only ones who study at Aspen University. At this time, 4 states are represented by the student population at the school.
Online Learning at Aspen University
The following chart shows how the online learning population at Aspen University has changed over the last few years.

The following table shows the 1-year growth rate of Aspen University majors that offer at least one online course. This table only includes majors with positive growth.
| Major | 1-Year Growth Rate |
|---|---|
| Computer & Information Sciences | 36% |
| Health Professions | 2% |
Aspen University Graduate Concentrations
The table below shows the number of awards for each concentration.
| Major | Master’s | Doctor’s | TOTAL |
|---|---|---|---|
| Nursing | 379 | 40 | 419 |
| Educational Administration | 11 | 41 | 52 |
| Business Administration & Management | 34 | 0 | 34 |
| Clinical, Counseling & Applied Psychology | 18 | 0 | 18 |
| Computer Programming | 16 | 0 | 16 |
| Criminal Justice & Corrections | 13 | 0 | 13 |
| Computer Science | 0 | 6 | 6 |
| Computer Information Systems | 5 | 0 | 5 |
| Finance & Financial Management | 3 | 0 | 3 |
| Management Information Systems | 2 | 0 | 2 |
| Information Technology | 1 | 0 | 1 |
| Entrepreneurial Studies | 0 | 0 | 0 |
| Teacher Education Grade Specific | 0 | 0 | 0 |
| Health & Medical Administrative Services | 0 | 0 | 0 |
| TOTAL | 482 | 87 | 569 |
References
*The racial-ethnic minorities count is calculated by taking the total number of students and subtracting white students, international students, and students whose race/ethnicity was unknown. This number is then divided by the total number of students at the school to obtain the racial-ethnic minorities percentage.
More about our data sources and methodologies.
Featured Schools
 Request Info
|
Southern New Hampshire University You have goals. Southern New Hampshire University can help you get there. Whether you need a bachelor's degree to get into a career or want a master's degree to move up in your current career, SNHU has an online program for you. Find your degree from over 200 online programs. Learn More > |
